| Zacks Company Profile for Ryman Hospitality Properties, Inc. (RHP : NYSE) |
|
|
| |
| • Company Description |
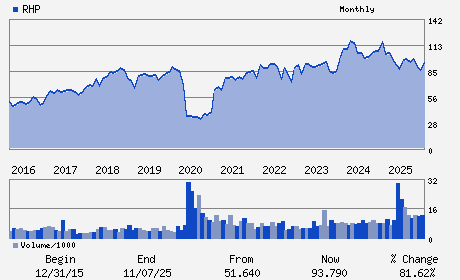
| Ryman Hospitality Properties, Inc. is a Real Estate Investment Trust specializing in group-oriented, destination hotel assets in urban and resort markets. The Company also operates a number of media and entertainment assets that includes the Grand Ole Opry, the Ryman Auditorium and WSM-AM. Ryman Hospitality Properties, Inc. is headquartered in Nashville, Tennessee.
Number of Employees: 1,819 |
|
|
| |
| • Price / Volume Information |
| Yesterday's Closing Price: $98.75 |
Daily Weekly Monthly
 |
| 20 Day Moving Average: 554,676 shares |
| Shares Outstanding: 63.01 (millions) |
| Market Capitalization: $6,221.85 (millions) |
| Beta: 1.18 |
| 52 Week High: $105.75 |
| 52 Week Low: $76.27 |
| Short Interest Ratio: |
| |
% Price Change |
% Price Change Relative to S&P 500 |
| 4 Week |
4.28% |
5.19% |
| 12 Week |
7.64% |
7.51% |
| Year To Date |
4.36% |
3.86% |
|
|
|
|
| |
|
|
| |
| • General Corporate Information |
Officers
Mark Fioravanti - President and Chief Executive Officer
Colin V. Reed - Executive Chairman
Jennifer Hutcheson - Executive Vice President; Chief Financial Officer
Rachna Bhasin - Director
H. Eric Bolton - Director
|
|
Peer Information
Ryman Hospitality Properties, Inc. (ARE)
Ryman Hospitality Properties, Inc. (CUZ)
Ryman Hospitality Properties, Inc. (FUR)
Ryman Hospitality Properties, Inc. (NNN)
Ryman Hospitality Properties, Inc. (FCH)
Ryman Hospitality Properties, Inc. (CTO)
|
|
Industry / Sector / Ticker Info
Analyst Coverage: No
Industry Group: REIT-EQTY TRUST -OTHER
Sector: Finance
CUSIP: 78377T107
SIC: 6798
|
|
Fiscal Year
Fiscal Year End: December
Last Reported Quarter: 12/01/25
Next Expected EPS Date: 05/07/26
|
|
Share - Related Items
Shares Outstanding: 63.01
Most Recent Split Date: 10.00 (0.33:1)
Beta: 1.18
Market Capitalization: $6,221.85 (millions)
|
|
|
|
|
| |
| • EPS Information |
• Dividend Information |
| Analyst Coverage: No |
Dividend Yield: 4.86% |
| Current Fiscal Quarter EPS Consensus Estimate: $2.11 |
Indicated Annual Dividend: $4.80 |
| Current Fiscal Year EPS Consensus Estimate: $8.65 |
Payout Ratio: 0.57 |
| Number of Estimates in the Fiscal Year Consensus: 4.00 |
Change In Payout Ratio: 0.18 |
| Estmated Long-Term EPS Growth Rate: 4.36% |
Last Dividend Paid: 12/31/2025 - $1.20 |
| Next EPS Report Date: 05/07/26 |
|
|
|
| |