| Zacks Company Profile for Rocket Companies, Inc. (RKT : NYSE) |
|
|
| |
| • Company Description |
| Rocket Companies Inc.is a holding company consisting of personal finance and consumer service brands including Rocket Mortgage, Rocket Homes, Rocket Loans, Rocket Auto, Rock Central, Amrock, Core Digital Media, Rock Connections, Lendesk and Edison Financial. Rocket Companies Inc.is based in DETROIT.
Number of Employees: 23,500 |
|
|
| |
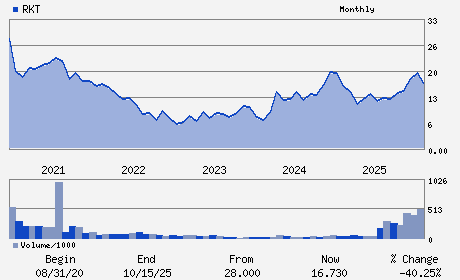
| • Price / Volume Information |
| Yesterday's Closing Price: $14.76 |
Daily Weekly Monthly
 |
| 20 Day Moving Average: 29,023,984 shares |
| Shares Outstanding: 2,104.52 (millions) |
| Market Capitalization: $31,062.71 (millions) |
| Beta: 2.30 |
| 52 Week High: $24.36 |
| 52 Week Low: $10.94 |
| Short Interest Ratio: |
| |
% Price Change |
% Price Change Relative to S&P 500 |
| 4 Week |
-20.99% |
-19.37% |
| 12 Week |
-23.25% |
-21.19% |
| Year To Date |
-23.76% |
-22.10% |
|
|
|
|
| |
|
|
| |
| • General Corporate Information |
Officers
Varun Krishna - Chief Executive Officer and Director
Daniel Gilbert - Chairman of the Board of Directors
Brian Brown - President; Chief Financial Officer and Treasurer
Noah Edwards - Chief Accounting Officer
Jay Bray - Director
|
|
Peer Information
Rocket Companies, Inc. (DFCLQ)
Rocket Companies, Inc. (VEL)
Rocket Companies, Inc. (CFC)
Rocket Companies, Inc. (T.FTI)
Rocket Companies, Inc. (CLNH.)
Rocket Companies, Inc. (BFSC)
|
|
Industry / Sector / Ticker Info
Analyst Coverage: No
Industry Group: FIN-MTG&REL SVS
Sector: Finance
CUSIP: 77311W101
SIC: 6162
|
|
Fiscal Year
Fiscal Year End: December
Last Reported Quarter: 12/01/25
Next Expected EPS Date: 05/14/26
|
|
Share - Related Items
Shares Outstanding: 2,104.52
Most Recent Split Date: (:1)
Beta: 2.30
Market Capitalization: $31,062.71 (millions)
|
|
|
|
|
| |
| • EPS Information |
• Dividend Information |
| Analyst Coverage: No |
Dividend Yield: 0.00% |
| Current Fiscal Quarter EPS Consensus Estimate: $0.14 |
Indicated Annual Dividend: $0.00 |
| Current Fiscal Year EPS Consensus Estimate: $0.75 |
Payout Ratio: 0.00 |
| Number of Estimates in the Fiscal Year Consensus: 4.00 |
Change In Payout Ratio: |
| Estmated Long-Term EPS Growth Rate: % |
Last Dividend Paid: NA - $0.00 |
| Next EPS Report Date: 05/14/26 |
|
|
|
| |