| Zacks Company Profile for Rimini Street, Inc. (RMNI : NSDQ) |
|
|
| |
| • Company Description |
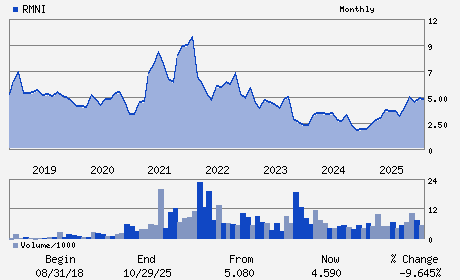
| Rimini Street, Inc. provides enterprise software support services. The Company's support services program consists of support, risk avoidance, technology support, innovation and roadmap, account management and archiving services, as well as global tax, legal and regulatory update services. It serves the education and public sector. Rimini Street, Inc. is based in Las Vegas, United States.
Number of Employees: 1,980 |
|
|
| |
| • Price / Volume Information |
| Yesterday's Closing Price: $3.11 |
Daily Weekly Monthly
 |
| 20 Day Moving Average: 293,645 shares |
| Shares Outstanding: 91.66 (millions) |
| Market Capitalization: $285.08 (millions) |
| Beta: 1.28 |
| 52 Week High: $5.38 |
| 52 Week Low: $2.79 |
| Short Interest Ratio: |
| |
% Price Change |
% Price Change Relative to S&P 500 |
| 4 Week |
-16.40% |
-9.70% |
| 12 Week |
-18.16% |
-11.87% |
| Year To Date |
-19.84% |
-13.85% |
|
|
|
|
| |
|
|
| |
| • General Corporate Information |
Officers
Seth A. Ravin - President; Chief Executive Officer and Chairman of
Michael L. Perica - Executive Vice President and Chief Financial Offic
Jack L. Acosta - Director
Steve Capelli - Director
Robin Murray - Director
|
|
Peer Information
Rimini Street, Inc. (ADP)
Rimini Street, Inc. (CWLD)
Rimini Street, Inc. (CYBA.)
Rimini Street, Inc. (ZVLO)
Rimini Street, Inc. (AZPN)
Rimini Street, Inc. (ATIS)
|
|
Industry / Sector / Ticker Info
Analyst Coverage: No
Industry Group: INTERNET SOFTWARE
Sector: Computer and Technology
CUSIP: 76674Q107
SIC: 7389
|
|
Fiscal Year
Fiscal Year End: December
Last Reported Quarter: 12/01/25
Next Expected EPS Date: 05/07/26
|
|
Share - Related Items
Shares Outstanding: 91.66
Most Recent Split Date: (:1)
Beta: 1.28
Market Capitalization: $285.08 (millions)
|
|
|
|
|
| |
| • EPS Information |
• Dividend Information |
| Analyst Coverage: No |
Dividend Yield: 0.00% |
| Current Fiscal Quarter EPS Consensus Estimate: $0.05 |
Indicated Annual Dividend: $0.00 |
| Current Fiscal Year EPS Consensus Estimate: $0.30 |
Payout Ratio: 0.00 |
| Number of Estimates in the Fiscal Year Consensus: 2.00 |
Change In Payout Ratio: 0.00 |
| Estmated Long-Term EPS Growth Rate: % |
Last Dividend Paid: NA - $0.00 |
| Next EPS Report Date: 05/07/26 |
|
|
|
| |