| Zacks Company Profile for Rockwell Medical, Inc. (RMTI : NSDQ) |
|
|
| |
| • Company Description |
| Rockwell Medical Technologies, Inc. manufactures hemodialysis concentrates and dialysis kits, and sells, distributes and delivers such concentrates and dialysis kits, as well as other ancillary hemodialysis products, to hemodialysis providers in the United States. Hemodialysis is a process which is able to duplicate kidney function in patients whose kidneys have failed to function properly.
Number of Employees: 157 |
|
|
| |
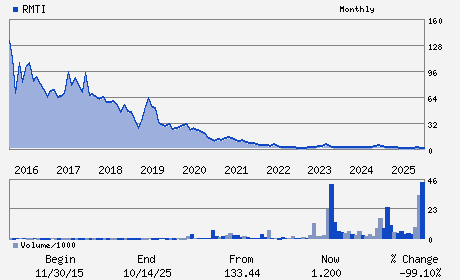
| • Price / Volume Information |
| Yesterday's Closing Price: $0.62 |
Daily Weekly Monthly
 |
| 20 Day Moving Average: 332,099 shares |
| Shares Outstanding: 39.47 (millions) |
| Market Capitalization: $24.66 (millions) |
| Beta: 1.58 |
| 52 Week High: $2.10 |
| 52 Week Low: $0.60 |
| Short Interest Ratio: |
| |
% Price Change |
% Price Change Relative to S&P 500 |
| 4 Week |
-21.56% |
-20.82% |
| 12 Week |
-39.34% |
-46.07% |
| Year To Date |
-25.04% |
-30.85% |
|
|
|
|
| |
|
|
| |
| • General Corporate Information |
Officers
Mark Strobeck - Chief Executive Officer and President
Robert S. Radie - Chairman
Jesse Neri - Chief Financial Officer and Senior Vice President
John G. Cooper - Director
Joseph Dawson - Director
|
|
Peer Information
Rockwell Medical, Inc. (BJCT)
Rockwell Medical, Inc. (CADMQ)
Rockwell Medical, Inc. (APNO)
Rockwell Medical, Inc. (UPDC)
Rockwell Medical, Inc. (IMTIQ)
Rockwell Medical, Inc. (CYGN)
|
|
Industry / Sector / Ticker Info
Analyst Coverage: No
Industry Group: MED PRODUCTS
Sector: Medical
CUSIP: 774374300
SIC: 2834
|
|
Fiscal Year
Fiscal Year End: December
Last Reported Quarter: 03/01/26
Next Expected EPS Date: 08/13/26
|
|
Share - Related Items
Shares Outstanding: 39.47
Most Recent Split Date: 5.00 (0.09:1)
Beta: 1.58
Market Capitalization: $24.66 (millions)
|
|
|
|
|
| |
| • EPS Information |
• Dividend Information |
| Analyst Coverage: No |
Dividend Yield: 0.00% |
| Current Fiscal Quarter EPS Consensus Estimate: $-0.02 |
Indicated Annual Dividend: $0.00 |
| Current Fiscal Year EPS Consensus Estimate: $-0.08 |
Payout Ratio: |
| Number of Estimates in the Fiscal Year Consensus: 1.00 |
Change In Payout Ratio: |
| Estmated Long-Term EPS Growth Rate: % |
Last Dividend Paid: NA - $0.00 |
| Next EPS Report Date: 08/13/26 |
|
|
|
| |