| Zacks Company Profile for Rapid7, Inc. (RPD : NSDQ) |
|
|
| |
| • Company Description |
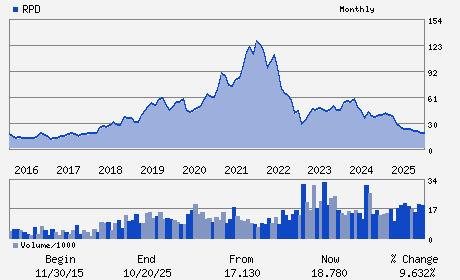
| Rapid7, Inc. offers security data and analytics solutions. The Company provides solutions which consist of threat exposure management, incident detection and response solutions as well as security advisory services. Rapid7, Inc. is based in Boston, United States.
Number of Employees: 2,613 |
|
|
| |
| • Price / Volume Information |
| Yesterday's Closing Price: $6.31 |
Daily Weekly Monthly
 |
| 20 Day Moving Average: 2,465,193 shares |
| Shares Outstanding: 65.89 (millions) |
| Market Capitalization: $415.79 (millions) |
| Beta: 0.89 |
| 52 Week High: $30.95 |
| 52 Week Low: $5.92 |
| Short Interest Ratio: |
| |
% Price Change |
% Price Change Relative to S&P 500 |
| 4 Week |
-3.96% |
1.99% |
| 12 Week |
-59.03% |
-56.36% |
| Year To Date |
-58.49% |
-56.32% |
|
|
|
|
| |
|
|
| |
| • General Corporate Information |
Officers
Corey E. Thomas - Chief Executive Officer and Director
Rafeal E. Brown - Chief Financial Officer
Scott Murphy - Chief Accounting Officer
Marc Brown - Director
Michael Berry - Director
|
|
Peer Information
Rapid7, Inc. (ADP)
Rapid7, Inc. (CWLD)
Rapid7, Inc. (CYBA.)
Rapid7, Inc. (ZVLO)
Rapid7, Inc. (AZPN)
Rapid7, Inc. (ATIS)
|
|
Industry / Sector / Ticker Info
Analyst Coverage: No
Industry Group: INTERNET SOFTWARE
Sector: Computer and Technology
CUSIP: 753422104
SIC: 7372
|
|
Fiscal Year
Fiscal Year End: December
Last Reported Quarter: 12/01/25
Next Expected EPS Date: 05/11/26
|
|
Share - Related Items
Shares Outstanding: 65.89
Most Recent Split Date: (:1)
Beta: 0.89
Market Capitalization: $415.79 (millions)
|
|
|
|
|
| |
| • EPS Information |
• Dividend Information |
| Analyst Coverage: No |
Dividend Yield: 0.00% |
| Current Fiscal Quarter EPS Consensus Estimate: $0.03 |
Indicated Annual Dividend: $0.00 |
| Current Fiscal Year EPS Consensus Estimate: $0.58 |
Payout Ratio: 0.00 |
| Number of Estimates in the Fiscal Year Consensus: 11.00 |
Change In Payout Ratio: |
| Estmated Long-Term EPS Growth Rate: % |
Last Dividend Paid: NA - $0.00 |
| Next EPS Report Date: 05/11/26 |
|
|
|
| |