| Zacks Company Profile for Sinclair, Inc. (SBGI : NSDQ) |
|
|
| |
| • Company Description |
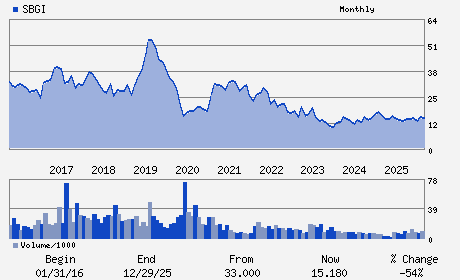
| Sinclair Inc. is a diversified media company and a provider of local news and sports. The Company owns, operates and/or provides services to television stations. Sinclair Inc., formerly known as Sinclair Broadcast Group Inc., is based in HUNT VALLEY, Md.
Number of Employees: 7,200 |
|
|
| |
| • Price / Volume Information |
| Yesterday's Closing Price: $15.82 |
Daily Weekly Monthly
 |
| 20 Day Moving Average: 432,272 shares |
| Shares Outstanding: 69.68 (millions) |
| Market Capitalization: $1,102.39 (millions) |
| Beta: 0.94 |
| 52 Week High: $17.88 |
| 52 Week Low: $11.89 |
| Short Interest Ratio: |
| |
% Price Change |
% Price Change Relative to S&P 500 |
| 4 Week |
9.25% |
10.76% |
| 12 Week |
7.91% |
7.36% |
| Year To Date |
3.40% |
2.86% |
|
|
|
|
| |
| • Address & Contact Information |
| Street Address |
Phone / Fax |
Email Address |
Web URL |
10706 BEAVER DAM ROAD
-
HUNT VALLEY,MD 21030
USA |
ph: 410-568-1500
fax: 410-568-1533 |
chrisking@sbgtv.com |
http://www.sbgi.net |
|
|
| |
| • General Corporate Information |
Officers
Christopher S. Ripley - President and Chief Executive Officer
David D. Smith - Chairman of the Board and Executive Chairman
Narinder K. Sahai - Executive Vice President and Chief Financial Offic
David R. Bochenek - Senior Vice President and Chief Accounting Officer
Frederick G. Smith - Director
|
|
Peer Information
Sinclair, Inc. (PSO)
Sinclair, Inc. (LSXMK)
Sinclair, Inc. (ACCS)
Sinclair, Inc. (TKVR)
Sinclair, Inc. (TST)
Sinclair, Inc. (PARAA)
|
|
Industry / Sector / Ticker Info
Analyst Coverage: No
Industry Group: MEDIA CONGLOM
Sector: Consumer Discretionary
CUSIP: 829242106
SIC: 4833
|
|
Fiscal Year
Fiscal Year End: December
Last Reported Quarter: 12/01/25
Next Expected EPS Date: 05/06/26
|
|
Share - Related Items
Shares Outstanding: 69.68
Most Recent Split Date: 5.00 (2.00:1)
Beta: 0.94
Market Capitalization: $1,102.39 (millions)
|
|
|
|
|
| |
| • EPS Information |
• Dividend Information |
| Analyst Coverage: No |
Dividend Yield: 6.32% |
| Current Fiscal Quarter EPS Consensus Estimate: $ |
Indicated Annual Dividend: $1.00 |
| Current Fiscal Year EPS Consensus Estimate: $1.09 |
Payout Ratio: |
| Number of Estimates in the Fiscal Year Consensus: 3.00 |
Change In Payout Ratio: |
| Estmated Long-Term EPS Growth Rate: % |
Last Dividend Paid: 12/01/2025 - $0.25 |
| Next EPS Report Date: 05/06/26 |
|
|
|
| |