| Zacks Company Profile for SCI Engineered Materials Inc. (SCIA : OTC) |
|
|
| |
| • Company Description |
| SCI Engineered Materials, Inc., an Ohio corporation, manufacture ceramic and metal sputtering targets for a variety of industrial applications including: Photonics, Thin Film Solar, Thin Film Battery, Semiconductor, and, to a lesser extent HTS materials. Photonics currently represents the largest market for our targets. Thin Film Solar is an industry that is exhibiting rapid growth and we expect this market to grow quickly. Thin Film Battery is a developing market where manufacturers of batteries use our targets to produce very small power supplies with small quantities of stored energy. Semiconductor is a developing market for us. The company serves domestic and multi-national corporations, universities, and research institutions. It distributes its products through direct sales force and independent manufacturers' representatives in the United States, as well as through independent distributors in the international markets. The company is based in Columbus, Ohio.
Number of Employees: 25 |
|
|
| |
| • Price / Volume Information |
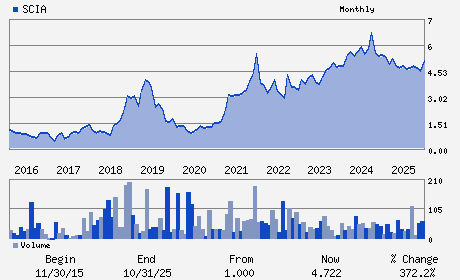
| Yesterday's Closing Price: $4.91 |
Daily Weekly Monthly
 |
| 20 Day Moving Average: 3,094 shares |
| Shares Outstanding: 4.45 (millions) |
| Market Capitalization: $21.85 (millions) |
| Beta: 0.96 |
| 52 Week High: $5.99 |
| 52 Week Low: $3.80 |
| Short Interest Ratio: |
| |
% Price Change |
% Price Change Relative to S&P 500 |
| 4 Week |
-0.91% |
3.46% |
| 12 Week |
-10.73% |
-5.03% |
| Year To Date |
-7.88% |
-3.41% |
|
|
|
|
| |
| • Address & Contact Information |
| Street Address |
Phone / Fax |
Email Address |
Web URL |
2839 CHARTER STREET
-
COLUMBUS,OH 43228
USA |
ph: 614-486-0261
fax: 800-292-8654 |
None |
http://www.sciengineeredmaterials.com |
|
|
| |
| • General Corporate Information |
Officers
Jeremiah R. Young - Director and Chief Executive Officer
Laura F. Shunk - Chairperson
Gerald S. Blaskie - Vice President and Chief Financial Officer
Vince Crisler - Director
John P. Gilliam - Director
|
|
Peer Information
SCI Engineered Materials Inc. (CPCL.)
SCI Engineered Materials Inc. (HIFN)
SCI Engineered Materials Inc. (SEM.1)
SCI Engineered Materials Inc. (DION)
SCI Engineered Materials Inc. (AMKR)
SCI Engineered Materials Inc. (CNXT.)
|
|
Industry / Sector / Ticker Info
Analyst Coverage: No
Industry Group: ELEC COMP-SEMIC
Sector: Computer and Technology
CUSIP: 78402S108
SIC: 3620
|
|
Fiscal Year
Fiscal Year End: December
Last Reported Quarter: 12/01/25
Next Expected EPS Date: 05/01/26
|
|
Share - Related Items
Shares Outstanding: 4.45
Most Recent Split Date: (:1)
Beta: 0.96
Market Capitalization: $21.85 (millions)
|
|
|
|
|
| |
| • EPS Information |
• Dividend Information |
| Analyst Coverage: No |
Dividend Yield: 0.00% |
| Current Fiscal Quarter EPS Consensus Estimate: $ |
Indicated Annual Dividend: $0.00 |
| Current Fiscal Year EPS Consensus Estimate: $ |
Payout Ratio: 0.00 |
| Number of Estimates in the Fiscal Year Consensus: |
Change In Payout Ratio: 0.00 |
| Estmated Long-Term EPS Growth Rate: % |
Last Dividend Paid: NA - $0.00 |
| Next EPS Report Date: 05/01/26 |
|
|
|
| |