| Zacks Company Profile for Sycamore Entertainment Group Inc. (SEGI : OTC) |
|
|
| |
| • Company Description |
| Sycamore Entertainment Group LLC, formerly known as Sycamore Films, Inc, is engaged in acquisition, marketing and distribution of finished feature-length motion pictures. It is involved in film acquisitions, publicity, print advertising, billboard advertising, film distribution and online marketing. The Company also provides market specific publicity, promotion, media buying, theatrical placement and Print and & Advertising financing for theatrical domestic release. Sycamore Entertainment Group LLC is based in Hollywood, California.
Number of Employees: |
|
|
| |
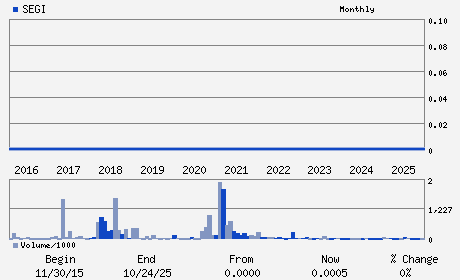
| • Price / Volume Information |
| Yesterday's Closing Price: $0.00 |
Daily Weekly Monthly
 |
| 20 Day Moving Average: 1,705,011 shares |
| Shares Outstanding: (millions) |
| Market Capitalization: $ (millions) |
| Beta: 1.01 |
| 52 Week High: $0.00 |
| 52 Week Low: $0.00 |
| Short Interest Ratio: |
| |
% Price Change |
% Price Change Relative to S&P 500 |
| 4 Week |
-25.00% |
-20.97% |
| 12 Week |
0.00% |
3.85% |
| Year To Date |
% |
% |
|
|
|
|
| |
| • Address & Contact Information |
| Street Address |
Phone / Fax |
Email Address |
Web URL |
LEXINGTON AVENUE SUITE 120
-
HOLLYWOOD,CA 90038
USA |
ph: 323-790-1717
fax: 520-791-2437 |
imarx@imarx.com |
http://www.imarx.com |
|
|
| |
| • General Corporate Information |
Officers
Richard L. Love - Chairman of Board; Principal Executive Officer and
Richard E. Otto - Director
James M. Strickland - Director
Philip C. Ranker - Director
Thomas W. Pew - Director
|
|
Peer Information
- (-)
- (-)
- (-)
- (-)
- (-)
- (-)
|
|
Industry / Sector / Ticker Info
Analyst Coverage: No
Industry Group: MEDIA CONGLOM
Sector: Consumer Discretionary
CUSIP: 871156105
SIC: 2834
|
|
Fiscal Year
Fiscal Year End: December
Last Reported Quarter: -
Next Expected EPS Date: -
|
|
Share - Related Items
Shares Outstanding:
Most Recent Split Date: (:1)
Beta: 1.01
Market Capitalization: $ (millions)
|
|
|
|
|
| |
| • EPS Information |
• Dividend Information |
| Analyst Coverage: No |
Dividend Yield: 0.00% |
| Current Fiscal Quarter EPS Consensus Estimate: $ |
Indicated Annual Dividend: $0.00 |
| Current Fiscal Year EPS Consensus Estimate: $ |
Payout Ratio: |
| Number of Estimates in the Fiscal Year Consensus: |
Change In Payout Ratio: |
| Estmated Long-Term EPS Growth Rate: % |
Last Dividend Paid: NA - $0.00 |
| Next EPS Report Date: - |
|
|
|
| |