| Zacks Company Profile for Sangamo Therapeutics, Inc. (SGMO : NSDQ) |
|
|
| |
| • Company Description |
| Sangamo Therapeutics, Inc. is a biotechnology company. It focuses on research and development of genomic therapies as well as develops medicines for patient with genetic diseases. The Company's product pipeline includes SB-525, SB-FIX, SB-318, SB-913, SB-728-T and SB-728-HSPC. Sangamo Therapeutics Inc., formerly known as Sangamo BioSciences Inc., is based in Richmond, United States.
Number of Employees: 183 |
|
|
| |
| • Price / Volume Information |
| Yesterday's Closing Price: $0.32 |
Daily Weekly Monthly
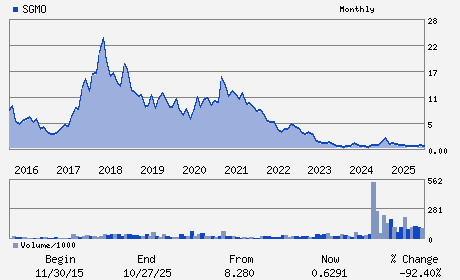 |
| 20 Day Moving Average: 4,885,938 shares |
| Shares Outstanding: 336.49 (millions) |
| Market Capitalization: $107.98 (millions) |
| Beta: 1.33 |
| 52 Week High: $0.85 |
| 52 Week Low: $0.31 |
| Short Interest Ratio: |
| |
% Price Change |
% Price Change Relative to S&P 500 |
| 4 Week |
-27.07% |
-20.88% |
| 12 Week |
-23.59% |
-17.88% |
| Year To Date |
-23.59% |
-13.41% |
|
|
|
|
| |
| • Address & Contact Information |
| Street Address |
Phone / Fax |
Email Address |
Web URL |
501 Canal Blvd
-
Richmond,CA 94804
USA |
ph: 510-970-6000
fax: 510-236-8951 |
ir@sangamo.com |
http://www.sangamo.com |
|
|
| |
| • General Corporate Information |
Officers
Alexander D. Macrae - President; Chief Executive Officer
H. Stewart Parker - Director and Chair of the Board
Prathyusha Duraibabu - Senior Vice President and Chief Financial Officer
Courtney Beers - Director
Robert F. Carey - Director
|
|
Peer Information
Sangamo Therapeutics, Inc. (CORR.)
Sangamo Therapeutics, Inc. (RSPI)
Sangamo Therapeutics, Inc. (CGXP)
Sangamo Therapeutics, Inc. (BGEN)
Sangamo Therapeutics, Inc. (GTBP)
Sangamo Therapeutics, Inc. (RGRX)
|
|
Industry / Sector / Ticker Info
Analyst Coverage: No
Industry Group: MED-BIOMED/GENE
Sector: Medical
CUSIP: 800677106
SIC: 2836
|
|
Fiscal Year
Fiscal Year End: December
Last Reported Quarter: 09/01/25
Next Expected EPS Date: 03/30/26
|
|
Share - Related Items
Shares Outstanding: 336.49
Most Recent Split Date: 6.00 (1.25:1)
Beta: 1.33
Market Capitalization: $107.98 (millions)
|
|
|
|
|
| |
| • EPS Information |
• Dividend Information |
| Analyst Coverage: No |
Dividend Yield: 0.00% |
| Current Fiscal Quarter EPS Consensus Estimate: $-0.04 |
Indicated Annual Dividend: $0.00 |
| Current Fiscal Year EPS Consensus Estimate: $-0.10 |
Payout Ratio: |
| Number of Estimates in the Fiscal Year Consensus: 1.00 |
Change In Payout Ratio: |
| Estmated Long-Term EPS Growth Rate: % |
Last Dividend Paid: NA - $0.00 |
| Next EPS Report Date: 03/30/26 |
|
|
|
| |