| Zacks Company Profile for SPAR Group, Inc. (SGRP : NSDQ) |
|
|
| |
| • Company Description |
| The SPAR Group, Inc. is a supplier of in-store merchandising and marketing services, and premium incentive marketing services throughout the United States and Canada. The company also provides database marketing, teleservices, marketing research, and Internet-based software. The company's operations are divided into three divisions: the Merchandising Services Division, the Incentive Marketing Division, and the Internet Division.
Number of Employees: 3,425 |
|
|
| |
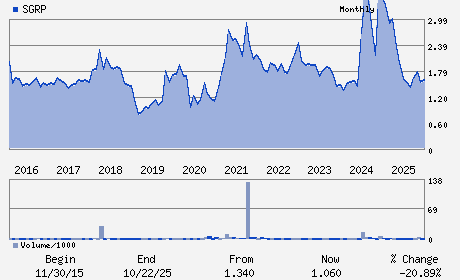
| • Price / Volume Information |
| Yesterday's Closing Price: $0.70 |
Daily Weekly Monthly
 |
| 20 Day Moving Average: 47,819 shares |
| Shares Outstanding: 23.95 (millions) |
| Market Capitalization: $16.76 (millions) |
| Beta: 0.07 |
| 52 Week High: $1.60 |
| 52 Week Low: $0.70 |
| Short Interest Ratio: |
| |
% Price Change |
% Price Change Relative to S&P 500 |
| 4 Week |
-12.50% |
-5.08% |
| 12 Week |
-11.50% |
-4.88% |
| Year To Date |
-11.50% |
-3.92% |
|
|
|
|
| |
|
|
| |
| • General Corporate Information |
Officers
Michael R. Matacunas - Chief Executive Officer; President and Director
Antonio Calisto Pato - Chief Financial Officer; Treasurer and Secretary
James R. Gillis - Director
John Bode - Director
Linda Houston - Director
|
|
Peer Information
SPAR Group, Inc. (AGIS)
SPAR Group, Inc. (SKCO)
SPAR Group, Inc. (AWWC)
SPAR Group, Inc. (AQUX)
SPAR Group, Inc. (AVSV)
SPAR Group, Inc. (AMGC)
|
|
Industry / Sector / Ticker Info
Analyst Coverage: No
Industry Group: BUSINESS SVCS
Sector: Business Services
CUSIP: 784933103
SIC: 7389
|
|
Fiscal Year
Fiscal Year End: December
Last Reported Quarter: 09/01/25
Next Expected EPS Date: 03/27/26
|
|
Share - Related Items
Shares Outstanding: 23.95
Most Recent Split Date: (:1)
Beta: 0.07
Market Capitalization: $16.76 (millions)
|
|
|
|
|
| |
| • EPS Information |
• Dividend Information |
| Analyst Coverage: No |
Dividend Yield: 0.00% |
| Current Fiscal Quarter EPS Consensus Estimate: $ |
Indicated Annual Dividend: $0.00 |
| Current Fiscal Year EPS Consensus Estimate: $ |
Payout Ratio: |
| Number of Estimates in the Fiscal Year Consensus: |
Change In Payout Ratio: |
| Estmated Long-Term EPS Growth Rate: % |
Last Dividend Paid: NA - $0.00 |
| Next EPS Report Date: 03/27/26 |
|
|
|
| |