| Zacks Company Profile for Shake Shack, Inc. (SHAK : NYSE) |
|
|
| |
| • Company Description |
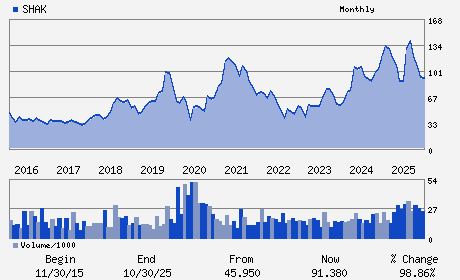
| Shake Shack, Inc. is a New York-based fast food hamburger restaurant chain. Shake Shack restaurants operate in the United States and internationally. It is one of the nation's largest hamburger chains offering beef burgers, flat-top dogs, chicken sandwiches, frozen custard and crinkle cut and other food items.
Number of Employees: 13,873 |
|
|
| |
| • Price / Volume Information |
| Yesterday's Closing Price: $83.53 |
Daily Weekly Monthly
 |
| 20 Day Moving Average: 1,305,665 shares |
| Shares Outstanding: 42.69 (millions) |
| Market Capitalization: $3,566.10 (millions) |
| Beta: 1.73 |
| 52 Week High: $144.65 |
| 52 Week Low: $72.93 |
| Short Interest Ratio: |
| |
% Price Change |
% Price Change Relative to S&P 500 |
| 4 Week |
-11.55% |
-4.05% |
| 12 Week |
0.02% |
8.83% |
| Year To Date |
2.91% |
11.05% |
|
|
|
|
| |
|
|
| |
| • General Corporate Information |
Officers
Robert Lynch - Chief Executive Officer and Director
Daniel Meyer - Chairman
Peter Herpich - Chief Financial Officer
Sumaiya Balbale - Director
Charles J. Chapman - Director
|
|
Peer Information
Shake Shack, Inc. (BH)
Shake Shack, Inc. (BUCA)
Shake Shack, Inc. (BUNZQ)
Shake Shack, Inc. (FRRG)
Shake Shack, Inc. (CHEF.)
Shake Shack, Inc. (BGMTQ)
|
|
Industry / Sector / Ticker Info
Analyst Coverage: No
Industry Group: RETAIL-RESTRNTS
Sector: Retail/Wholesale
CUSIP: 819047101
SIC: 5810
|
|
Fiscal Year
Fiscal Year End: December
Last Reported Quarter: 12/01/25
Next Expected EPS Date: 05/07/26
|
|
Share - Related Items
Shares Outstanding: 42.69
Most Recent Split Date: (:1)
Beta: 1.73
Market Capitalization: $3,566.10 (millions)
|
|
|
|
|
| |
| • EPS Information |
• Dividend Information |
| Analyst Coverage: No |
Dividend Yield: 0.00% |
| Current Fiscal Quarter EPS Consensus Estimate: $0.11 |
Indicated Annual Dividend: $0.00 |
| Current Fiscal Year EPS Consensus Estimate: $1.37 |
Payout Ratio: 0.00 |
| Number of Estimates in the Fiscal Year Consensus: 12.00 |
Change In Payout Ratio: 0.00 |
| Estmated Long-Term EPS Growth Rate: 13.53% |
Last Dividend Paid: NA - $0.00 |
| Next EPS Report Date: 05/07/26 |
|
|
|
| |