| Zacks Company Profile for Shin-Etsu Chemical Co. (SHECY : OTC) |
|
|
| |
| • Company Description |
| Shin-Etsu Chemical Co., Ltd. is engaged in the production and distribution of polyvinyl chloride and silicon wafers. The Company's products include of polyvinyl chloride, silicones, rare earths, rare earth magnets, epoxy molding compounds, synthetic Quartz, semiconductor silicon and cellulose derivatives. Shin-Etsu Chemical Co., Ltd. is headquartered in Tokyo, Japan.
Number of Employees: 27,274 |
|
|
| |
| • Price / Volume Information |
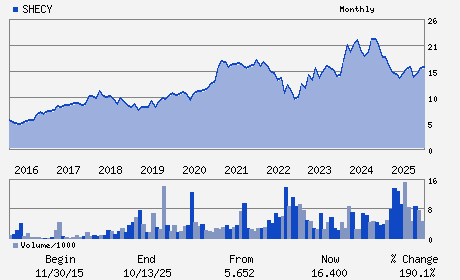
| Yesterday's Closing Price: $20.86 |
Daily Weekly Monthly
 |
| 20 Day Moving Average: 373,509 shares |
| Shares Outstanding: 3,969.99 (millions) |
| Market Capitalization: $82,814.03 (millions) |
| Beta: 1.30 |
| 52 Week High: $24.72 |
| 52 Week Low: $13.64 |
| Short Interest Ratio: |
| |
% Price Change |
% Price Change Relative to S&P 500 |
| 4 Week |
-11.46% |
-9.30% |
| 12 Week |
2.00% |
-7.01% |
| Year To Date |
34.58% |
26.77% |
|
|
|
|
| |
| • Address & Contact Information |
| Street Address |
Phone / Fax |
Email Address |
Web URL |
4-1 Marunouchi 1-chome Chiyoda-ku
-
Tokyo,M0 100-0005
JPN |
ph: 813-6812-2340
fax: 813-3246-5096 |
sec-pr@shinetsu.jp |
http://www.shinetsu.co.jp |
|
|
| |
| • General Corporate Information |
Officers
Fumio Akiya - Chairman
Yasuhiko Saitoh - President
Susumu Ueno - Director
Masahiko Todoroki - Director
Shunzo Mor - Director
|
|
Peer Information
Shin-Etsu Chemical Co. (ENFY)
Shin-Etsu Chemical Co. (EMLIF)
Shin-Etsu Chemical Co. (GPLB)
Shin-Etsu Chemical Co. (BCPUQ)
Shin-Etsu Chemical Co. (CYT.)
Shin-Etsu Chemical Co. (SOA)
|
|
Industry / Sector / Ticker Info
Analyst Coverage: No
Industry Group: CHEM-DIVERSIFD
Sector: Basic Materials
CUSIP: 824551105
SIC: 8880
|
|
Fiscal Year
Fiscal Year End: March
Last Reported Quarter: 03/01/26
Next Expected EPS Date: 07/23/26
|
|
Share - Related Items
Shares Outstanding: 3,969.99
Most Recent Split Date: 4.00 (2.50:1)
Beta: 1.30
Market Capitalization: $82,814.03 (millions)
|
|
|
|
|
| |
| • EPS Information |
• Dividend Information |
| Analyst Coverage: No |
Dividend Yield: 0.55% |
| Current Fiscal Quarter EPS Consensus Estimate: $ |
Indicated Annual Dividend: $0.12 |
| Current Fiscal Year EPS Consensus Estimate: $0.93 |
Payout Ratio: 0.27 |
| Number of Estimates in the Fiscal Year Consensus: 1.00 |
Change In Payout Ratio: 0.03 |
| Estmated Long-Term EPS Growth Rate: % |
Last Dividend Paid: NA - $0.00 |
| Next EPS Report Date: 07/23/26 |
|
|
|
| |