| Zacks Company Profile for SINTX TECHNOLOGIES, INC. (SINT : NSDQ) |
|
|
| |
| • Company Description |
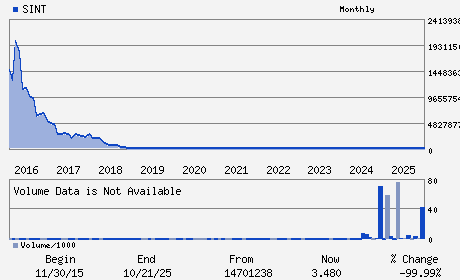
| SINTX Technologies Inc. is a biomaterials and OEM company. It develops and commercializes silicon nitride for biomedical applications including the spine, dental, oral maxillofacial, podiatry and arthroplasty markets. SINTX Technologies Inc., formerly known as Amedica Corporation, is based in UT, United States.
Number of Employees: 20 |
|
|
| |
| • Price / Volume Information |
| Yesterday's Closing Price: $2.49 |
Daily Weekly Monthly
 |
| 20 Day Moving Average: 39,733 shares |
| Shares Outstanding: 3.68 (millions) |
| Market Capitalization: $9.17 (millions) |
| Beta: 0.66 |
| 52 Week High: $6.78 |
| 52 Week Low: $1.71 |
| Short Interest Ratio: |
| |
% Price Change |
% Price Change Relative to S&P 500 |
| 4 Week |
-17.82% |
-12.73% |
| 12 Week |
-33.42% |
-29.09% |
| Year To Date |
-35.49% |
-32.13% |
|
|
|
|
| |
| • Address & Contact Information |
| Street Address |
Phone / Fax |
Email Address |
Web URL |
1885 West 2100 South
-
Salt Lake City,UT 84119
USA |
ph: 801-839-3500
fax: - |
ir@sintx.com |
http://www.sintx.com |
|
|
| |
| • General Corporate Information |
Officers
Eric Olson - President and Chief Executive Officer
B. Sonny Bal - Chairman
David W. Truetzel - Director
Jeffrey S. White - Director
Eric A. Stookey - Director
|
|
Peer Information
SINTX TECHNOLOGIES, INC. (ABMD)
SINTX TECHNOLOGIES, INC. (DMDS)
SINTX TECHNOLOGIES, INC. (CPWY.)
SINTX TECHNOLOGIES, INC. (EQUR)
SINTX TECHNOLOGIES, INC. (ECIA)
SINTX TECHNOLOGIES, INC. (FMS)
|
|
Industry / Sector / Ticker Info
Analyst Coverage: No
Industry Group: MED INSTRUMENTS
Sector: Medical
CUSIP: 829392703
SIC: 3841
|
|
Fiscal Year
Fiscal Year End: December
Last Reported Quarter: 09/01/25
Next Expected EPS Date: 05/21/26
|
|
Share - Related Items
Shares Outstanding: 3.68
Most Recent Split Date: 5.00 (0.01:1)
Beta: 0.66
Market Capitalization: $9.17 (millions)
|
|
|
|
|
| |
| • EPS Information |
• Dividend Information |
| Analyst Coverage: No |
Dividend Yield: 0.00% |
| Current Fiscal Quarter EPS Consensus Estimate: $-0.54 |
Indicated Annual Dividend: $0.00 |
| Current Fiscal Year EPS Consensus Estimate: $-2.13 |
Payout Ratio: |
| Number of Estimates in the Fiscal Year Consensus: 1.00 |
Change In Payout Ratio: |
| Estmated Long-Term EPS Growth Rate: % |
Last Dividend Paid: NA - $0.00 |
| Next EPS Report Date: 05/21/26 |
|
|
|
| |