| Zacks Company Profile for Smith & Nephew SNATS, Inc. (SNN : NYSE) |
|
|
| |
| • Company Description |
| Smith & Nephew is a global medical device company. The company markets clinically superior products, principally in orthopaedics, endoscopy and wound management to deliver cost-effective solutions, significant physicianadvantage and real patient benefits. A continuous process of supplying new and innovative products is supported by substantial R&D investment todeliver new levels of healing to patients throughout the world
Number of Employees: 16,988 |
|
|
| |
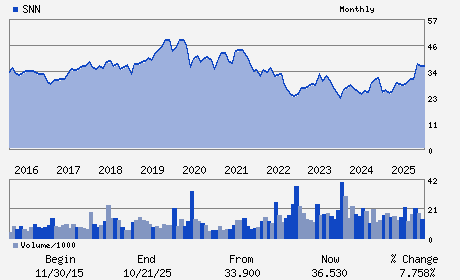
| • Price / Volume Information |
| Yesterday's Closing Price: $29.72 |
Daily Weekly Monthly
 |
| 20 Day Moving Average: 1,417,196 shares |
| Shares Outstanding: 426.99 (millions) |
| Market Capitalization: $12,690.02 (millions) |
| Beta: 0.57 |
| 52 Week High: $38.79 |
| 52 Week Low: $28.23 |
| Short Interest Ratio: |
| |
% Price Change |
% Price Change Relative to S&P 500 |
| 4 Week |
-12.15% |
-17.54% |
| 12 Week |
-16.68% |
-23.78% |
| Year To Date |
-9.42% |
-17.34% |
|
|
|
|
| |
|
|
| |
| • General Corporate Information |
Officers
Deepak Nath - Chief Executive Officer
Rupert Soames - Chairman
John Rogers - Chief Financial Officer
Bob White - Independent Non-Executive Director
Rick Medlock - Independent Non-Executive Director
|
|
Peer Information
Smith & Nephew SNATS, Inc. (BJCT)
Smith & Nephew SNATS, Inc. (CADMQ)
Smith & Nephew SNATS, Inc. (APNO)
Smith & Nephew SNATS, Inc. (UPDC)
Smith & Nephew SNATS, Inc. (IMTIQ)
Smith & Nephew SNATS, Inc. (CYGN)
|
|
Industry / Sector / Ticker Info
Analyst Coverage: No
Industry Group: MED PRODUCTS
Sector: Medical
CUSIP: 83175M205
SIC: 3842
|
|
Fiscal Year
Fiscal Year End: December
Last Reported Quarter: -
Next Expected EPS Date: -
|
|
Share - Related Items
Shares Outstanding: 426.99
Most Recent Split Date: 10.00 (2.50:1)
Beta: 0.57
Market Capitalization: $12,690.02 (millions)
|
|
|
|
|
| |
| • EPS Information |
• Dividend Information |
| Analyst Coverage: No |
Dividend Yield: 3.14% |
| Current Fiscal Quarter EPS Consensus Estimate: $ |
Indicated Annual Dividend: $0.93 |
| Current Fiscal Year EPS Consensus Estimate: $2.24 |
Payout Ratio: |
| Number of Estimates in the Fiscal Year Consensus: 2.00 |
Change In Payout Ratio: |
| Estmated Long-Term EPS Growth Rate: 13.59% |
Last Dividend Paid: 03/27/2026 - $0.47 |
| Next EPS Report Date: - |
|
|
|
| |