| Zacks Company Profile for DNA X, Inc. (SONM : NSDQ) |
|
|
| |
| • Company Description |
| Sonim Technologies Inc. provides ultra-rugged mobile phones and accessories. It provides its solutions under categories of ultra-rugged mobile phones based on the Android platform, which are capable of attaching to both public and private wireless networks; industrial-grade accessories and cloud-based software and application services. The company serves construction, energy and utility, hospitality, logistics, manufacturing, public sector and transportation sectors. Sonim Technologies Inc. is based in San Mateo, United States.
Number of Employees: 160 |
|
|
| |
| • Price / Volume Information |
| Yesterday's Closing Price: $2.90 |
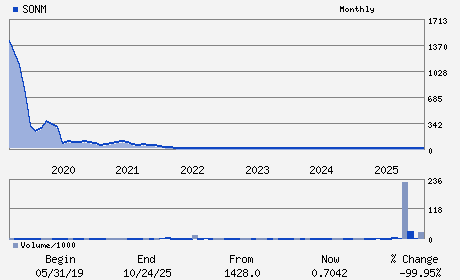
Daily Weekly Monthly
 |
| 20 Day Moving Average: 24,414 shares |
| Shares Outstanding: 1.03 (millions) |
| Market Capitalization: $2.98 (millions) |
| Beta: 1.60 |
| 52 Week High: $61.00 |
| 52 Week Low: $2.52 |
| Short Interest Ratio: |
| |
% Price Change |
% Price Change Relative to S&P 500 |
| 4 Week |
-44.87% |
-42.72% |
| 12 Week |
-6.45% |
-1.84% |
| Year To Date |
-7.94% |
-4.24% |
|
|
|
|
| |
|
|
| |
| • General Corporate Information |
Officers
Hao Liu - Chief Executive Officer
Mike Mulica - Chairman
Clay Crolius - Chief Financial Officer
Jeffrey Wang - Director
Jack Steenstra - Director
|
|
Peer Information
DNA X, Inc. (CMTL)
DNA X, Inc. (UMAC)
DNA X, Inc. (ANEN)
DNA X, Inc. (ERIC)
DNA X, Inc. (CLUS)
DNA X, Inc. (BKTI)
|
|
Industry / Sector / Ticker Info
Analyst Coverage: No
Industry Group: Wireless Equipment
Sector: Computer and Technology
CUSIP: 83548F408
SIC: 3661
|
|
Fiscal Year
Fiscal Year End: December
Last Reported Quarter: 09/01/25
Next Expected EPS Date: 03/27/26
|
|
Share - Related Items
Shares Outstanding: 1.03
Most Recent Split Date: 10.00 (0.06:1)
Beta: 1.60
Market Capitalization: $2.98 (millions)
|
|
|
|
|
| |
| • EPS Information |
• Dividend Information |
| Analyst Coverage: No |
Dividend Yield: 0.00% |
| Current Fiscal Quarter EPS Consensus Estimate: $ |
Indicated Annual Dividend: $0.00 |
| Current Fiscal Year EPS Consensus Estimate: $ |
Payout Ratio: |
| Number of Estimates in the Fiscal Year Consensus: |
Change In Payout Ratio: |
| Estmated Long-Term EPS Growth Rate: % |
Last Dividend Paid: NA - $0.00 |
| Next EPS Report Date: 03/27/26 |
|
|
|
| |