| Zacks Company Profile for SPX Technologies, Inc. (SPXC : NYSE) |
|
|
| |
| • Company Description |
| SPX Technologies Inc. is a diversified supplier of highly engineered products and technologies, holding positions in the HVAC and detection and measurement markets. SPX Technologies Inc., formerly known as SPX Corporation, is based in CHARLOTTE, N.C.
Number of Employees: 4,700 |
|
|
| |
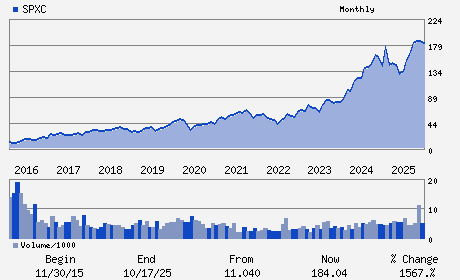
| • Price / Volume Information |
| Yesterday's Closing Price: $203.50 |
Daily Weekly Monthly
 |
| 20 Day Moving Average: 572,029 shares |
| Shares Outstanding: 50.18 (millions) |
| Market Capitalization: $10,210.97 (millions) |
| Beta: 1.31 |
| 52 Week High: $246.68 |
| 52 Week Low: $147.39 |
| Short Interest Ratio: |
| |
% Price Change |
% Price Change Relative to S&P 500 |
| 4 Week |
-5.47% |
-11.26% |
| 12 Week |
-15.56% |
-22.76% |
| Year To Date |
1.72% |
-7.17% |
|
|
|
|
| |
| • Address & Contact Information |
| Street Address |
Phone / Fax |
Email Address |
Web URL |
6325 ARDREY KELL ROAD SUITE 400
-
CHARLOTTE,NC 28277
USA |
ph: 980-474-3700
fax: 302-655-5049 |
spx.investor@spx.com |
http://www.spx.com |
|
|
| |
| • General Corporate Information |
Officers
Eugene J. Lowe, III - President and Chief Executive Officer
Mark A. Carano - Vice President; Chief Financial Officer and Treasu
Wayne M. McLaren - Vice President; Chief Accounting Officer and Corpo
Ruth G. Shaw - Director
David A. Roberts - Director
|
|
Peer Information
SPX Technologies, Inc. (CCOM.)
SPX Technologies, Inc. (KGSPY)
SPX Technologies, Inc. (FBIN)
SPX Technologies, Inc. (LII)
SPX Technologies, Inc. (SPXC)
SPX Technologies, Inc. (MTINQ)
|
|
Industry / Sector / Ticker Info
Analyst Coverage: No
Industry Group: BLDG PRD-AIR/HT
Sector: Construction
CUSIP: 78473E103
SIC: 3540
|
|
Fiscal Year
Fiscal Year End: December
Last Reported Quarter: 03/01/26
Next Expected EPS Date: 07/30/26
|
|
Share - Related Items
Shares Outstanding: 50.18
Most Recent Split Date: 10.00 (2.00:1)
Beta: 1.31
Market Capitalization: $10,210.97 (millions)
|
|
|
|
|
| |
| • EPS Information |
• Dividend Information |
| Analyst Coverage: No |
Dividend Yield: 0.00% |
| Current Fiscal Quarter EPS Consensus Estimate: $1.89 |
Indicated Annual Dividend: $0.00 |
| Current Fiscal Year EPS Consensus Estimate: $7.97 |
Payout Ratio: 0.00 |
| Number of Estimates in the Fiscal Year Consensus: 7.00 |
Change In Payout Ratio: 0.00 |
| Estmated Long-Term EPS Growth Rate: 17.05% |
Last Dividend Paid: NA - $0.00 |
| Next EPS Report Date: 07/30/26 |
|
|
|
| |