| Zacks Company Profile for Stoneridge, Inc. (SRI : NYSE) |
|
|
| |
| • Company Description |
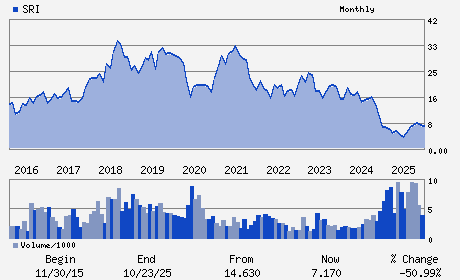
| Stoneridge Inc. is an independent designer and manufacturer of highly engineered electrical and electronic components, modules and systems forthe automotive, medium and heavy-duty truck, and agricultural vehicle markets. Their products interface with a vehicle's mechanical and electrical systems to activate equipment and accessories, display and monitor vehicle performance, and control and distribute electrical power and signals.
Number of Employees: 4,200 |
|
|
| |
| • Price / Volume Information |
| Yesterday's Closing Price: $5.65 |
Daily Weekly Monthly
 |
| 20 Day Moving Average: 270,355 shares |
| Shares Outstanding: 28.02 (millions) |
| Market Capitalization: $158.30 (millions) |
| Beta: 1.45 |
| 52 Week High: $9.71 |
| 52 Week Low: $3.54 |
| Short Interest Ratio: |
| |
% Price Change |
% Price Change Relative to S&P 500 |
| 4 Week |
-29.20% |
-26.44% |
| 12 Week |
-2.75% |
2.04% |
| Year To Date |
-2.42% |
1.50% |
|
|
|
|
| |
|
|
| |
| • General Corporate Information |
Officers
James Zizelman - President; Chief Executive Officer and Director
William M. Lasky - Chairman
James Zizelman - President; Chief Executive Officer and Director
Matthew R. Horvath - Chief Financial Officer and Treasurer
Kim Korth - Director
|
|
Peer Information
Stoneridge, Inc. (SMTI.)
Stoneridge, Inc. (DDICQ)
Stoneridge, Inc. (CGGIQ)
Stoneridge, Inc. (CRDN)
Stoneridge, Inc. (CDTS)
Stoneridge, Inc. (AURAQ)
|
|
Industry / Sector / Ticker Info
Analyst Coverage: No
Industry Group: ELEC-MISC COMPONENTS
Sector: Computer and Technology
CUSIP: 86183P102
SIC: 3714
|
|
Fiscal Year
Fiscal Year End: December
Last Reported Quarter: 12/01/25
Next Expected EPS Date: 04/29/26
|
|
Share - Related Items
Shares Outstanding: 28.02
Most Recent Split Date: (:1)
Beta: 1.45
Market Capitalization: $158.30 (millions)
|
|
|
|
|
| |
| • EPS Information |
• Dividend Information |
| Analyst Coverage: No |
Dividend Yield: 0.00% |
| Current Fiscal Quarter EPS Consensus Estimate: $-0.19 |
Indicated Annual Dividend: $0.00 |
| Current Fiscal Year EPS Consensus Estimate: $-0.31 |
Payout Ratio: |
| Number of Estimates in the Fiscal Year Consensus: 1.00 |
Change In Payout Ratio: |
| Estmated Long-Term EPS Growth Rate: % |
Last Dividend Paid: NA - $0.00 |
| Next EPS Report Date: 04/29/26 |
|
|
|
| |