| Zacks Company Profile for Stag Industrial, Inc. (STAG : NYSE) |
|
|
| |
| • Company Description |
| STAG Industrial, Inc. operates as a real estate company focused on the acquisition, ownership and management of single-tenant industrial properties throughout the United States. STAG Industrial, Inc. is based in United States.
Number of Employees: 93 |
|
|
| |
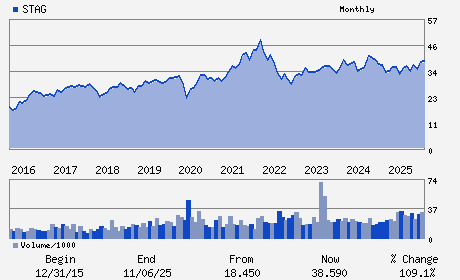
| • Price / Volume Information |
| Yesterday's Closing Price: $37.19 |
Daily Weekly Monthly
 |
| 20 Day Moving Average: 1,397,605 shares |
| Shares Outstanding: 191.17 (millions) |
| Market Capitalization: $7,109.62 (millions) |
| Beta: 1.04 |
| 52 Week High: $39.98 |
| 52 Week Low: $28.61 |
| Short Interest Ratio: |
| |
% Price Change |
% Price Change Relative to S&P 500 |
| 4 Week |
-3.08% |
-0.66% |
| 12 Week |
-1.22% |
3.96% |
| Year To Date |
1.17% |
4.67% |
|
|
|
|
| |
|
|
| |
| • General Corporate Information |
Officers
William R. Crooker - President; Chief Executive Officer and Director
Larry T. Guillemette - Chairman of the Board
Matts S. Pinard - Chief Financial Officer; Executive Vice President
Jaclyn M. Paul - Chief Accounting Officer
Benjamin S. Butcher - Director
|
|
Peer Information
Stag Industrial, Inc. (ARE)
Stag Industrial, Inc. (CUZ)
Stag Industrial, Inc. (FUR)
Stag Industrial, Inc. (NNN)
Stag Industrial, Inc. (FCH)
Stag Industrial, Inc. (CTO)
|
|
Industry / Sector / Ticker Info
Analyst Coverage: No
Industry Group: REIT-EQTY TRUST -OTHER
Sector: Finance
CUSIP: 85254J102
SIC: 6798
|
|
Fiscal Year
Fiscal Year End: December
Last Reported Quarter: 12/01/25
Next Expected EPS Date: 04/28/26
|
|
Share - Related Items
Shares Outstanding: 191.17
Most Recent Split Date: (:1)
Beta: 1.04
Market Capitalization: $7,109.62 (millions)
|
|
|
|
|
| |
| • EPS Information |
• Dividend Information |
| Analyst Coverage: No |
Dividend Yield: 4.17% |
| Current Fiscal Quarter EPS Consensus Estimate: $0.65 |
Indicated Annual Dividend: $1.55 |
| Current Fiscal Year EPS Consensus Estimate: $2.63 |
Payout Ratio: 0.58 |
| Number of Estimates in the Fiscal Year Consensus: 1.00 |
Change In Payout Ratio: -0.07 |
| Estmated Long-Term EPS Growth Rate: % |
Last Dividend Paid: 03/31/2026 - $0.39 |
| Next EPS Report Date: 04/28/26 |
|
|
|
| |