| Zacks Company Profile for Tactile Systems Technology, Inc. (TCMD : NSDQ) |
|
|
| |
| • Company Description |
| Tactile Systems Technology, Inc. is a medical technology company which develops medical devices for the treatment of chronic diseases at home. The company's product pipeline consists of Flexitouch System(R), the Entr? System and the ACTitouch System (R). Tactile Systems Technology, Inc. is headquartered in Minneapolis, Minnesota.
Number of Employees: 1,086 |
|
|
| |
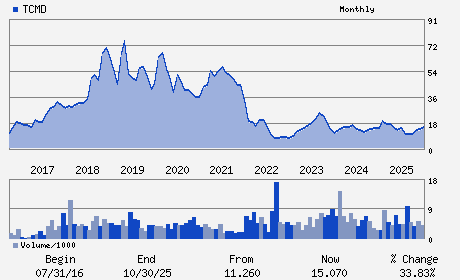
| • Price / Volume Information |
| Yesterday's Closing Price: $25.88 |
Daily Weekly Monthly
 |
| 20 Day Moving Average: 266,387 shares |
| Shares Outstanding: 22.75 (millions) |
| Market Capitalization: $588.78 (millions) |
| Beta: 0.97 |
| 52 Week High: $37.28 |
| 52 Week Low: $8.61 |
| Short Interest Ratio: |
| |
% Price Change |
% Price Change Relative to S&P 500 |
| 4 Week |
-11.64% |
-4.15% |
| 12 Week |
-14.11% |
-6.55% |
| Year To Date |
-10.76% |
-3.70% |
|
|
|
|
| |
|
|
| |
| • General Corporate Information |
Officers
Sheri L. Dodd - Chief Executive Officer
William W. Burke - Chairman of the Board of Directors
Elaine M. Birkemeyer - Chief Financial Officer
Valerie L. Asbury - Director
Laura G. King - Director
|
|
Peer Information
Tactile Systems Technology, Inc. (ABMD)
Tactile Systems Technology, Inc. (DMDS)
Tactile Systems Technology, Inc. (CPWY.)
Tactile Systems Technology, Inc. (EQUR)
Tactile Systems Technology, Inc. (ECIA)
Tactile Systems Technology, Inc. (FMS)
|
|
Industry / Sector / Ticker Info
Analyst Coverage: No
Industry Group: MED INSTRUMENTS
Sector: Medical
CUSIP: 87357P100
SIC: 3841
|
|
Fiscal Year
Fiscal Year End: December
Last Reported Quarter: 12/01/25
Next Expected EPS Date: 05/04/26
|
|
Share - Related Items
Shares Outstanding: 22.75
Most Recent Split Date: (:1)
Beta: 0.97
Market Capitalization: $588.78 (millions)
|
|
|
|
|
| |
| • EPS Information |
• Dividend Information |
| Analyst Coverage: No |
Dividend Yield: 0.00% |
| Current Fiscal Quarter EPS Consensus Estimate: $-0.07 |
Indicated Annual Dividend: $0.00 |
| Current Fiscal Year EPS Consensus Estimate: $1.14 |
Payout Ratio: 0.00 |
| Number of Estimates in the Fiscal Year Consensus: 3.00 |
Change In Payout Ratio: 0.00 |
| Estmated Long-Term EPS Growth Rate: % |
Last Dividend Paid: NA - $0.00 |
| Next EPS Report Date: 05/04/26 |
|
|
|
| |