| Zacks Company Profile for Terex Corporation (TEX : NYSE) |
|
|
| |
| • Company Description |
| Terex Corporation is a global manufacturer of aerial work platforms, materials processing machinery and cranes. It designs, build and support products used in construction, maintenance, manufacturing, energy, minerals and materials management applications. The company's manufacturing facilities are located in the United States, Canada, Europe, Australia, Asia and South America. Terex sells its products through a worldwide distribution network. Terex also offers a complete line of financial products and services to assist in the acquisition of equipment through Terex Financial Services.
Number of Employees: 10,700 |
|
|
| |
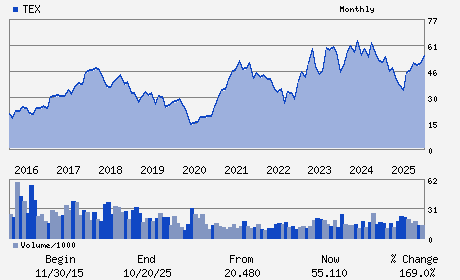
| • Price / Volume Information |
| Yesterday's Closing Price: $60.62 |
Daily Weekly Monthly
 |
| 20 Day Moving Average: 1,565,676 shares |
| Shares Outstanding: 113.70 (millions) |
| Market Capitalization: $6,892.49 (millions) |
| Beta: 1.62 |
| 52 Week High: $71.50 |
| 52 Week Low: $31.53 |
| Short Interest Ratio: |
| |
% Price Change |
% Price Change Relative to S&P 500 |
| 4 Week |
-11.95% |
-7.47% |
| 12 Week |
12.70% |
18.54% |
| Year To Date |
13.56% |
18.57% |
|
|
|
|
| |
|
|
| |
| • General Corporate Information |
Officers
Simon A. Meester - President; Chief Executive Officer and Director
David A. Sachs - Non-Executive Chairman
Jennifer Kong-Picarello - Senior Vice President and Chief Financial Officer
Stephen A. Johnston - Vice President; Chief Accounting Officer and Contr
David Dauch - Director
|
|
Peer Information
Terex Corporation (ASTE)
Terex Corporation (EMAT)
Terex Corporation (MTW)
Terex Corporation (KMTUY)
Terex Corporation (JOY)
Terex Corporation (CMI.)
|
|
Industry / Sector / Ticker Info
Analyst Coverage: No
Industry Group: MACH-CONST/MNG
Sector: Industrial Products
CUSIP: 880779103
SIC: 3537
|
|
Fiscal Year
Fiscal Year End: December
Last Reported Quarter: 12/01/25
Next Expected EPS Date: 05/01/26
|
|
Share - Related Items
Shares Outstanding: 113.70
Most Recent Split Date: 7.00 (2.00:1)
Beta: 1.62
Market Capitalization: $6,892.49 (millions)
|
|
|
|
|
| |
| • EPS Information |
• Dividend Information |
| Analyst Coverage: No |
Dividend Yield: 1.12% |
| Current Fiscal Quarter EPS Consensus Estimate: $0.81 |
Indicated Annual Dividend: $0.68 |
| Current Fiscal Year EPS Consensus Estimate: $4.87 |
Payout Ratio: 0.14 |
| Number of Estimates in the Fiscal Year Consensus: 11.00 |
Change In Payout Ratio: -0.01 |
| Estmated Long-Term EPS Growth Rate: 10.21% |
Last Dividend Paid: 03/06/2026 - $0.17 |
| Next EPS Report Date: 05/01/26 |
|
|
|
| |