| Zacks Company Profile for TransMedics Group, Inc. (TMDX : NSDQ) |
|
|
| |
| • Company Description |
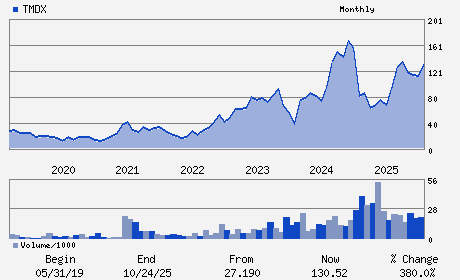
| TransMedics Inc. is a commercial-stage medical technology company. It is engaged in transforming organ transplant therapy for end-stage organ failure patients. The company offers Organ Care System, an integrated, compact, portable preservation technology which addresses unmet need for organs for transplantation. TransMedics Inc. is headquartered in Andover, Massachusetts.
Number of Employees: 898 |
|
|
| |
| • Price / Volume Information |
| Yesterday's Closing Price: $102.20 |
Daily Weekly Monthly
 |
| 20 Day Moving Average: 1,056,900 shares |
| Shares Outstanding: 34.30 (millions) |
| Market Capitalization: $3,505.71 (millions) |
| Beta: 1.98 |
| 52 Week High: $156.00 |
| 52 Week Low: $62.23 |
| Short Interest Ratio: |
| |
% Price Change |
% Price Change Relative to S&P 500 |
| 4 Week |
-24.05% |
-18.99% |
| 12 Week |
-15.99% |
-11.21% |
| Year To Date |
-15.99% |
-11.21% |
|
|
|
|
| |
|
|
| |
| • General Corporate Information |
Officers
Waleed H. Hassanein - President; Chief Executive Officer; Director
James R. Tobin - Chairman
Gerardo Hernandez - Chief Financial Officer and Treasurer
Edward M. Basile - Director
Thomas J. Gunderson - Director
|
|
Peer Information
TransMedics Group, Inc. (ABMD)
TransMedics Group, Inc. (DMDS)
TransMedics Group, Inc. (CPWY.)
TransMedics Group, Inc. (EQUR)
TransMedics Group, Inc. (ECIA)
TransMedics Group, Inc. (FMS)
|
|
Industry / Sector / Ticker Info
Analyst Coverage: No
Industry Group: MED INSTRUMENTS
Sector: Medical
CUSIP: 89377M109
SIC: 3845
|
|
Fiscal Year
Fiscal Year End: December
Last Reported Quarter: 12/01/25
Next Expected EPS Date: 05/14/26
|
|
Share - Related Items
Shares Outstanding: 34.30
Most Recent Split Date: (:1)
Beta: 1.98
Market Capitalization: $3,505.71 (millions)
|
|
|
|
|
| |
| • EPS Information |
• Dividend Information |
| Analyst Coverage: No |
Dividend Yield: 0.00% |
| Current Fiscal Quarter EPS Consensus Estimate: $0.62 |
Indicated Annual Dividend: $0.00 |
| Current Fiscal Year EPS Consensus Estimate: $2.48 |
Payout Ratio: 0.00 |
| Number of Estimates in the Fiscal Year Consensus: 6.00 |
Change In Payout Ratio: |
| Estmated Long-Term EPS Growth Rate: % |
Last Dividend Paid: NA - $0.00 |
| Next EPS Report Date: 05/14/26 |
|
|
|
| |