| Zacks Company Profile for Trex Company, Inc. (TREX : NYSE) |
|
|
| |
| • Company Description |
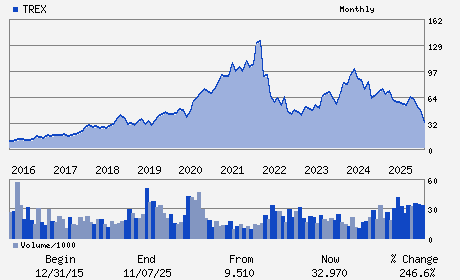
| Trex Company, Inc. is a manufacturer of wood-alternative decking and railing. Trex Company, Inc. is based in Winchester, United States.
Number of Employees: 1,839 |
|
|
| |
| • Price / Volume Information |
| Yesterday's Closing Price: $40.68 |
Daily Weekly Monthly
 |
| 20 Day Moving Average: 1,995,594 shares |
| Shares Outstanding: 105.74 (millions) |
| Market Capitalization: $4,301.40 (millions) |
| Beta: 1.58 |
| 52 Week High: $68.78 |
| 52 Week Low: $29.77 |
| Short Interest Ratio: |
| |
% Price Change |
% Price Change Relative to S&P 500 |
| 4 Week |
-2.02% |
-0.67% |
| 12 Week |
18.46% |
17.86% |
| Year To Date |
15.96% |
15.35% |
|
|
|
|
| |
| • Address & Contact Information |
| Street Address |
Phone / Fax |
Email Address |
Web URL |
2500 Trex Way
-
WINCHESTER,VA 22601
USA |
ph: 540-542-6300
fax: 540-678-1820 |
None |
http://www.trex.com |
|
|
| |
| • General Corporate Information |
Officers
Bryan H. Fairbanks - President and Chief Executive Officer
James E. Cline - Chairman
Ronald W. Kaplan - Vice Chairman
Prithvi S. Gandhi - Senior Vice President and Chief Financial Officer
Jay M. Gratz - Director
|
|
Peer Information
Trex Company, Inc. (DURX)
Trex Company, Inc. (NWGL)
Trex Company, Inc. (DEL)
Trex Company, Inc. (CRPP)
Trex Company, Inc. (POPE)
Trex Company, Inc. (BTEK.)
|
|
Industry / Sector / Ticker Info
Analyst Coverage: No
Industry Group: BLDG PRD-WOOD
Sector: Construction
CUSIP: 89531P105
SIC: 2400
|
|
Fiscal Year
Fiscal Year End: December
Last Reported Quarter: 12/01/25
Next Expected EPS Date: 05/14/26
|
|
Share - Related Items
Shares Outstanding: 105.74
Most Recent Split Date: 9.00 (2.00:1)
Beta: 1.58
Market Capitalization: $4,301.40 (millions)
|
|
|
|
|
| |
| • EPS Information |
• Dividend Information |
| Analyst Coverage: No |
Dividend Yield: 0.00% |
| Current Fiscal Quarter EPS Consensus Estimate: $0.51 |
Indicated Annual Dividend: $0.00 |
| Current Fiscal Year EPS Consensus Estimate: $1.64 |
Payout Ratio: 0.00 |
| Number of Estimates in the Fiscal Year Consensus: 7.00 |
Change In Payout Ratio: 0.00 |
| Estmated Long-Term EPS Growth Rate: 2.65% |
Last Dividend Paid: NA - $0.00 |
| Next EPS Report Date: 05/14/26 |
|
|
|
| |