| Zacks Company Profile for TeleTech Holdings, Inc. (TTEC : NSDQ) |
|
|
| |
| • Company Description |
| TTEC Holdings Inc. is a customer experience technology and services company. It focuses on the design, implementation and delivery of customer experience. The Company delivers outcome-based customer engagement solutions through TTEC Digital, digital consultancy which designs and builds human centric, tech-enabled, insight-driven customer experience solutions for clients and TTEC Engage, delivery center which operates customer acquisition, care, growth and digital trust and safety services. TTEC Holdings Inc., formerly known as TeleTech Holdings Inc., is based in Englewood, Colorado.
Number of Employees: 51,000 |
|
|
| |
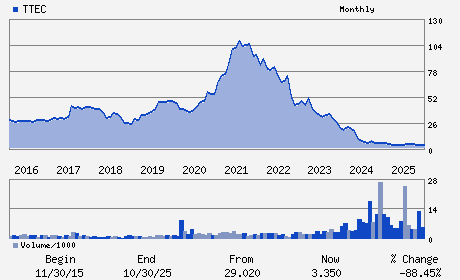
| • Price / Volume Information |
| Yesterday's Closing Price: $2.22 |
Daily Weekly Monthly
 |
| 20 Day Moving Average: 841,595 shares |
| Shares Outstanding: 48.57 (millions) |
| Market Capitalization: $107.82 (millions) |
| Beta: 1.08 |
| 52 Week High: $5.60 |
| 52 Week Low: $1.98 |
| Short Interest Ratio: |
| |
% Price Change |
% Price Change Relative to S&P 500 |
| 4 Week |
-11.20% |
-4.09% |
| 12 Week |
-37.81% |
-33.03% |
| Year To Date |
-38.33% |
-33.72% |
|
|
|
|
| |
|
|
| |
| • General Corporate Information |
Officers
Kenneth D. Tuchman - Chief Executive Officer
Kenneth R. Wagers, III - Chief Financial Officer
Steven J. Anenen - Director
Gregory A. Conley - Director
Marc L. Holtzman - Director
|
|
Peer Information
TeleTech Holdings, Inc. (EVOL)
TeleTech Holdings, Inc. (RAMP)
TeleTech Holdings, Inc. (LGTY)
TeleTech Holdings, Inc. (ALOT)
TeleTech Holdings, Inc. (CXT)
TeleTech Holdings, Inc. (TGHI)
|
|
Industry / Sector / Ticker Info
Analyst Coverage: No
Industry Group: Technology Services
Sector: Business Services
CUSIP: 89854H102
SIC: 7363
|
|
Fiscal Year
Fiscal Year End: December
Last Reported Quarter: 12/01/25
Next Expected EPS Date: 05/14/26
|
|
Share - Related Items
Shares Outstanding: 48.57
Most Recent Split Date: (:1)
Beta: 1.08
Market Capitalization: $107.82 (millions)
|
|
|
|
|
| |
| • EPS Information |
• Dividend Information |
| Analyst Coverage: No |
Dividend Yield: 0.00% |
| Current Fiscal Quarter EPS Consensus Estimate: $0.18 |
Indicated Annual Dividend: $0.00 |
| Current Fiscal Year EPS Consensus Estimate: $0.92 |
Payout Ratio: 0.00 |
| Number of Estimates in the Fiscal Year Consensus: 2.00 |
Change In Payout Ratio: -0.26 |
| Estmated Long-Term EPS Growth Rate: 8.00% |
Last Dividend Paid: NA - $0.00 |
| Next EPS Report Date: 05/14/26 |
|
|
|
| |