| Zacks Company Profile for Tetra Technologies, Inc. (TTI : NYSE) |
|
|
| |
| • Company Description |
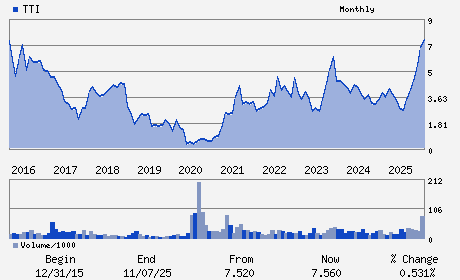
| TETRA Technologies, Inc. is a geographically diversified oil and gas services company, focused on completion fluids and associated products and services, water management, frac flowback, production well testing, offshore rig cooling, compression services and equipment, and selected offshore services including well plugging and abandonment, decommissioning, and diving. TETRA is comprised of three divisions - Fluids, Well Abandonment/Decommissioning and Testing & Services.
Number of Employees: 1,400 |
|
|
| |
| • Price / Volume Information |
| Yesterday's Closing Price: $8.66 |
Daily Weekly Monthly
 |
| 20 Day Moving Average: 1,808,838 shares |
| Shares Outstanding: 134.20 (millions) |
| Market Capitalization: $1,162.16 (millions) |
| Beta: 1.20 |
| 52 Week High: $12.54 |
| 52 Week Low: $2.03 |
| Short Interest Ratio: |
| |
% Price Change |
% Price Change Relative to S&P 500 |
| 4 Week |
-24.03% |
-23.37% |
| 12 Week |
2.85% |
2.72% |
| Year To Date |
-7.58% |
-8.03% |
|
|
|
|
| |
|
|
| |
| • General Corporate Information |
Officers
Brady M. Murphy - Chief Executive Officer;President and Director
John F. Glick - Chairman of the Board of Directors
Elijio V. Serrano - Senior Vice President and Chief Financial Officer
Katherine Kokenes - Vice President and Chief Accounting Officer
Thomas R. Bates, Jr. - Director
|
|
Peer Information
Tetra Technologies, Inc. (BJS)
Tetra Technologies, Inc. (CXIPY)
Tetra Technologies, Inc. (ALY)
Tetra Technologies, Inc. (HLX)
Tetra Technologies, Inc. (CNCJQ)
Tetra Technologies, Inc. (FGHLQ)
|
|
Industry / Sector / Ticker Info
Analyst Coverage: No
Industry Group: OIL-FIELD SVCS
Sector: Oils/Energy
CUSIP: 88162F105
SIC: 1311
|
|
Fiscal Year
Fiscal Year End: December
Last Reported Quarter: 12/01/25
Next Expected EPS Date: 05/05/26
|
|
Share - Related Items
Shares Outstanding: 134.20
Most Recent Split Date: 5.00 (2.00:1)
Beta: 1.20
Market Capitalization: $1,162.16 (millions)
|
|
|
|
|
| |
| • EPS Information |
• Dividend Information |
| Analyst Coverage: No |
Dividend Yield: 0.00% |
| Current Fiscal Quarter EPS Consensus Estimate: $0.04 |
Indicated Annual Dividend: $0.00 |
| Current Fiscal Year EPS Consensus Estimate: $0.26 |
Payout Ratio: 0.00 |
| Number of Estimates in the Fiscal Year Consensus: 3.00 |
Change In Payout Ratio: 0.00 |
| Estmated Long-Term EPS Growth Rate: % |
Last Dividend Paid: NA - $0.00 |
| Next EPS Report Date: 05/05/26 |
|
|
|
| |