| Zacks Company Profile for UFP Technologies, Inc. (UFPT : NSDQ) |
|
|
| |
| • Company Description |
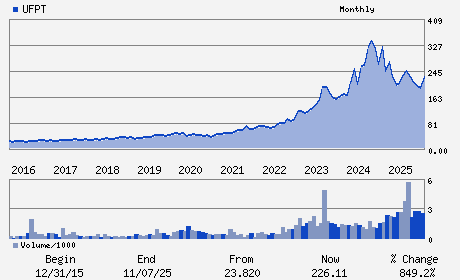
| UFP Technologies Inc. is a contract development and manufacturing organization that specializes in single-use and single-patient medical devices. The Company's single-use and single-patient devices and components are used in a wide range of medical devices and packaging for minimally invasive surgery, infection prevention, wound care, wearables, orthopedic soft goods and orthopedic implants. UFP Technologies Inc. is based in NEWBURYPORT, Mass.
Number of Employees: 4,335 |
|
|
| |
| • Price / Volume Information |
| Yesterday's Closing Price: $210.58 |
Daily Weekly Monthly
 |
| 20 Day Moving Average: 212,713 shares |
| Shares Outstanding: 7.71 (millions) |
| Market Capitalization: $1,624.09 (millions) |
| Beta: 1.13 |
| 52 Week High: $274.93 |
| 52 Week Low: $178.26 |
| Short Interest Ratio: |
| |
% Price Change |
% Price Change Relative to S&P 500 |
| 4 Week |
-16.15% |
-15.42% |
| 12 Week |
-3.02% |
-3.14% |
| Year To Date |
-5.16% |
-5.62% |
|
|
|
|
| |
|
|
| |
| • General Corporate Information |
Officers
R. Jeffrey Bailly - Chairman; Chief Executive Officer and Director
Ronald J. Lataille - Chief Financial Officer and Senior Vice President
Daniel C. Croteau - Director
Cynthia Feldmann - Director
Marc Kozin - Director
|
|
Peer Information
UFP Technologies, Inc. (ABMD)
UFP Technologies, Inc. (DMDS)
UFP Technologies, Inc. (CPWY.)
UFP Technologies, Inc. (EQUR)
UFP Technologies, Inc. (ECIA)
UFP Technologies, Inc. (FMS)
|
|
Industry / Sector / Ticker Info
Analyst Coverage: No
Industry Group: MED INSTRUMENTS
Sector: Medical
CUSIP: 902673102
SIC: 3841
|
|
Fiscal Year
Fiscal Year End: December
Last Reported Quarter: 12/01/25
Next Expected EPS Date: 05/05/26
|
|
Share - Related Items
Shares Outstanding: 7.71
Most Recent Split Date: (:1)
Beta: 1.13
Market Capitalization: $1,624.09 (millions)
|
|
|
|
|
| |
| • EPS Information |
• Dividend Information |
| Analyst Coverage: No |
Dividend Yield: 0.00% |
| Current Fiscal Quarter EPS Consensus Estimate: $2.18 |
Indicated Annual Dividend: $0.00 |
| Current Fiscal Year EPS Consensus Estimate: $10.20 |
Payout Ratio: 0.00 |
| Number of Estimates in the Fiscal Year Consensus: 3.00 |
Change In Payout Ratio: 0.00 |
| Estmated Long-Term EPS Growth Rate: % |
Last Dividend Paid: NA - $0.00 |
| Next EPS Report Date: 05/05/26 |
|
|
|
| |