| Zacks Company Profile for Venture Global, Inc. (VG : NYSE) |
|
|
| |
| • Company Description |
| Venture Global is a provider of U.S. LNG sourced from resource. The company's business includes assets across the LNG supply chain including LNG production, natural gas transport, shipping and regasification. Venture Global is based in ARLINGTON, Va.
Number of Employees: 2,000 |
|
|
| |
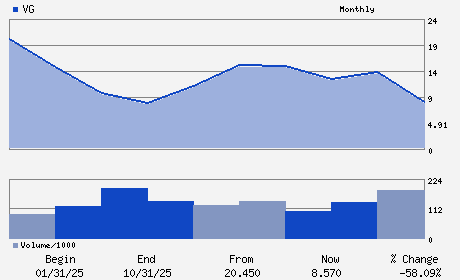
| • Price / Volume Information |
| Yesterday's Closing Price: $14.68 |
Daily Weekly Monthly
 |
| 20 Day Moving Average: 37,450,560 shares |
| Shares Outstanding: 2,456.97 (millions) |
| Market Capitalization: $36,068.32 (millions) |
| Beta: 1.84 |
| 52 Week High: $19.50 |
| 52 Week Low: $5.72 |
| Short Interest Ratio: |
| |
% Price Change |
% Price Change Relative to S&P 500 |
| 4 Week |
31.54% |
37.43% |
| 12 Week |
115.25% |
126.56% |
| Year To Date |
115.25% |
124.09% |
|
|
|
|
| |
|
|
| |
| • General Corporate Information |
Officers
Michael Sabel - Chief Executive Officer and Executive Co-Chairman
Robert Pender - Executive Co-Chairman and Founder
Jonathan Thayer - Chief Financial Officer
Sarah Blake - Chief Accounting Officer
Sari Granat - Director
|
|
Peer Information
Venture Global, Inc. (AEGG)
Venture Global, Inc. (CHAR)
Venture Global, Inc. (CECX.)
Venture Global, Inc. (DLOV)
Venture Global, Inc. (WACC)
Venture Global, Inc. (DVN)
|
|
Industry / Sector / Ticker Info
Analyst Coverage: No
Industry Group: OIL-US EXP&PROD
Sector: Oils/Energy
CUSIP: 92333F101
SIC: 4924
|
|
Fiscal Year
Fiscal Year End: December
Last Reported Quarter: 12/01/25
Next Expected EPS Date: 05/12/26
|
|
Share - Related Items
Shares Outstanding: 2,456.97
Most Recent Split Date: (:1)
Beta: 1.84
Market Capitalization: $36,068.32 (millions)
|
|
|
|
|
| |
| • EPS Information |
• Dividend Information |
| Analyst Coverage: No |
Dividend Yield: 0.49% |
| Current Fiscal Quarter EPS Consensus Estimate: $0.49 |
Indicated Annual Dividend: $0.07 |
| Current Fiscal Year EPS Consensus Estimate: $1.36 |
Payout Ratio: 0.08 |
| Number of Estimates in the Fiscal Year Consensus: 8.00 |
Change In Payout Ratio: |
| Estmated Long-Term EPS Growth Rate: 8.88% |
Last Dividend Paid: 03/16/2026 - $0.02 |
| Next EPS Report Date: 05/12/26 |
|
|
|
| |