| Zacks Company Profile for VNET Group, Inc. - Unsponsored ADR (VNET : NSDQ) |
|
|
| |
| • Company Description |
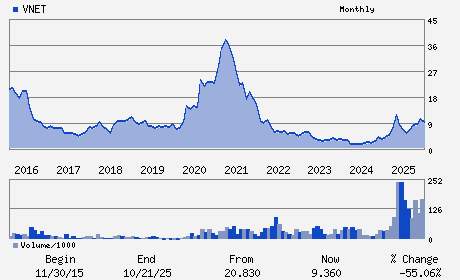
| VNET Group Inc. is a carrier and cloud neutral internet data center services provider principally in China. It provides hosting and related services, including IDC services, cloud services and business VPN services. VNET Group Inc., formerly known as 21Vianet Group Inc., is based in Beijing, China.
Number of Employees: 2,581 |
|
|
| |
| • Price / Volume Information |
| Yesterday's Closing Price: $8.81 |
Daily Weekly Monthly
 |
| 20 Day Moving Average: 7,343,103 shares |
| Shares Outstanding: 268.93 (millions) |
| Market Capitalization: $2,369.26 (millions) |
| Beta: 0.01 |
| 52 Week High: $14.48 |
| 52 Week Low: $4.65 |
| Short Interest Ratio: |
| |
% Price Change |
% Price Change Relative to S&P 500 |
| 4 Week |
-26.46% |
-22.72% |
| 12 Week |
3.89% |
9.28% |
| Year To Date |
4.14% |
8.73% |
|
|
|
|
| |
| • Address & Contact Information |
| Street Address |
Phone / Fax |
Email Address |
Web URL |
Guanjie Building Southeast 1st Floor 10# Jiuxianqiao East Road
-
Beijing,F4 100016
CHN |
ph: 86-10-8456-2121
fax: 86-10-8456-4234 |
None |
http://www.21vianet.com |
|
|
| |
| • General Corporate Information |
Officers
Sheng Chen - Chief Executive Officer;Executive Chairperson
Qiyu Wang - Chief Financial Officer
Jianbiao Zhu - Co-Chairperson of the Board of Directors and Execu
Yoshihisa Ueno - Director
Kenneth Chung-Hou Tai - Director
|
|
Peer Information
VNET Group, Inc. - Unsponsored ADR (ADP)
VNET Group, Inc. - Unsponsored ADR (CWLD)
VNET Group, Inc. - Unsponsored ADR (CYBA.)
VNET Group, Inc. - Unsponsored ADR (ZVLO)
VNET Group, Inc. - Unsponsored ADR (AZPN)
VNET Group, Inc. - Unsponsored ADR (ATIS)
|
|
Industry / Sector / Ticker Info
Analyst Coverage: No
Industry Group: INTERNET SOFTWARE
Sector: Computer and Technology
CUSIP: 90138A103
SIC: 7370
|
|
Fiscal Year
Fiscal Year End: December
Last Reported Quarter: 12/01/25
Next Expected EPS Date: 05/27/26
|
|
Share - Related Items
Shares Outstanding: 268.93
Most Recent Split Date: (:1)
Beta: 0.01
Market Capitalization: $2,369.26 (millions)
|
|
|
|
|
| |
| • EPS Information |
• Dividend Information |
| Analyst Coverage: No |
Dividend Yield: 0.00% |
| Current Fiscal Quarter EPS Consensus Estimate: $0.00 |
Indicated Annual Dividend: $0.00 |
| Current Fiscal Year EPS Consensus Estimate: $0.23 |
Payout Ratio: |
| Number of Estimates in the Fiscal Year Consensus: 4.00 |
Change In Payout Ratio: |
| Estmated Long-Term EPS Growth Rate: % |
Last Dividend Paid: NA - $0.00 |
| Next EPS Report Date: 05/27/26 |
|
|
|
| |