| Zacks Company Profile for VerifyMe, Inc. (VRME : NSDQ) |
|
|
| |
| • Company Description |
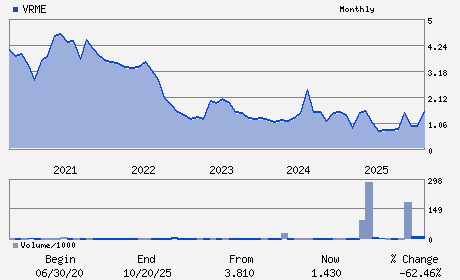
| VerifyMe, Inc. is a technology solutions provider specializing in brand protection functions such as counterfeit prevention, authentication, serialization, track and trace features for labels, packaging and products. The company's physical technology authenticates packaging, labels and documents with a suite of proprietary security inks and pigments, which work in conjunction with serialization and track-and-trace software known as VeriPAS(TM). VerifyMe, Inc. is based in NY.
Number of Employees: 40 |
|
|
| |
| • Price / Volume Information |
| Yesterday's Closing Price: $0.89 |
Daily Weekly Monthly
 |
| 20 Day Moving Average: 184,320 shares |
| Shares Outstanding: 12.44 (millions) |
| Market Capitalization: $11.04 (millions) |
| Beta: 0.39 |
| 52 Week High: $0.92 |
| 52 Week Low: $0.84 |
| Short Interest Ratio: |
| |
% Price Change |
% Price Change Relative to S&P 500 |
| 4 Week |
-16.28% |
-11.10% |
| 12 Week |
35.32% |
44.12% |
| Year To Date |
47.70% |
55.40% |
|
|
|
|
| |
| • Address & Contact Information |
| Street Address |
Phone / Fax |
Email Address |
Web URL |
801 INTERNATIONAL PARKWAY FIFTH FLOOR
-
LAKE MARY,FL 32746
USA |
ph: 585-736-9400
fax: - |
ir@verifyme.com |
http://www.verifyme.com |
|
|
| |
| • General Corporate Information |
Officers
Adam Stedham - Chief Executive Officer; President and Director
Scott Greenberg - Chairman and Director
Nancy Meyers - Executive Vice President and Chief Financial Offic
Marshall Geller - Director
Howard Goldberg - Director
|
|
Peer Information
VerifyMe, Inc. (EVOL)
VerifyMe, Inc. (RAMP)
VerifyMe, Inc. (LGTY)
VerifyMe, Inc. (ALOT)
VerifyMe, Inc. (CXT)
VerifyMe, Inc. (TGHI)
|
|
Industry / Sector / Ticker Info
Analyst Coverage: No
Industry Group: Technology Services
Sector: Business Services
CUSIP: 92346X206
SIC: 7373
|
|
Fiscal Year
Fiscal Year End: December
Last Reported Quarter: 09/01/25
Next Expected EPS Date: 03/26/26
|
|
Share - Related Items
Shares Outstanding: 12.44
Most Recent Split Date: (:1)
Beta: 0.39
Market Capitalization: $11.04 (millions)
|
|
|
|
|
| |
| • EPS Information |
• Dividend Information |
| Analyst Coverage: No |
Dividend Yield: 0.00% |
| Current Fiscal Quarter EPS Consensus Estimate: $-0.05 |
Indicated Annual Dividend: $0.00 |
| Current Fiscal Year EPS Consensus Estimate: $-0.10 |
Payout Ratio: |
| Number of Estimates in the Fiscal Year Consensus: 1.00 |
Change In Payout Ratio: |
| Estmated Long-Term EPS Growth Rate: % |
Last Dividend Paid: NA - $0.00 |
| Next EPS Report Date: 03/26/26 |
|
|
|
| |