| Zacks Company Profile for V2X, Inc. (VVX : NYSE) |
|
|
| |
| • Company Description |
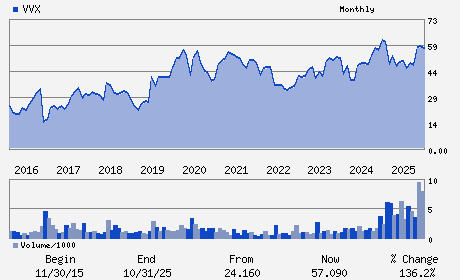
| V2X Inc. is a provider of critical mission solutions and support to defense clients. The Company delivers a comprehensive suite of integrated solutions across the operations and logistics, aerospace, training and technology markets to national security, defense, civilian and international clients. V2X Inc., formerly known as Vectrus Inc., is based in MCLEAN, Va.
Number of Employees: 16,200 |
|
|
| |
| • Price / Volume Information |
| Yesterday's Closing Price: $68.50 |
Daily Weekly Monthly
 |
| 20 Day Moving Average: 617,396 shares |
| Shares Outstanding: 31.27 (millions) |
| Market Capitalization: $2,142.00 (millions) |
| Beta: 0.14 |
| 52 Week High: $75.00 |
| 52 Week Low: $42.09 |
| Short Interest Ratio: |
| |
% Price Change |
% Price Change Relative to S&P 500 |
| 4 Week |
-6.06% |
-1.92% |
| 12 Week |
14.03% |
21.31% |
| Year To Date |
25.57% |
31.67% |
|
|
|
|
| |
| • Address & Contact Information |
| Street Address |
Phone / Fax |
Email Address |
Web URL |
2100 RESTON PARKWAY SUITE 300
-
RESTON,VA 20191
USA |
ph: 571-481-2000
fax: 719-591-3599 |
ir@gov2x.com |
http://www.gov2x.com |
|
|
| |
| • General Corporate Information |
Officers
Jeremy C. Wensinger - Chief Executive Officer; President and Director
Mary L. Howell - Chair and Director
Shawn M. Mural - Chief Financial Officer
David E. Farnsworth - Director
Gerard A. Fasano - Director
|
|
Peer Information
V2X, Inc. (EVOL)
V2X, Inc. (RAMP)
V2X, Inc. (LGTY)
V2X, Inc. (ALOT)
V2X, Inc. (CXT)
V2X, Inc. (TGHI)
|
|
Industry / Sector / Ticker Info
Analyst Coverage: No
Industry Group: Technology Services
Sector: Business Services
CUSIP: 92242T101
SIC: 8744
|
|
Fiscal Year
Fiscal Year End: December
Last Reported Quarter: 12/01/25
Next Expected EPS Date: 05/04/26
|
|
Share - Related Items
Shares Outstanding: 31.27
Most Recent Split Date: (:1)
Beta: 0.14
Market Capitalization: $2,142.00 (millions)
|
|
|
|
|
| |
| • EPS Information |
• Dividend Information |
| Analyst Coverage: No |
Dividend Yield: 0.00% |
| Current Fiscal Quarter EPS Consensus Estimate: $1.24 |
Indicated Annual Dividend: $0.00 |
| Current Fiscal Year EPS Consensus Estimate: $5.86 |
Payout Ratio: 0.00 |
| Number of Estimates in the Fiscal Year Consensus: 5.00 |
Change In Payout Ratio: 0.00 |
| Estmated Long-Term EPS Growth Rate: 20.20% |
Last Dividend Paid: NA - $0.00 |
| Next EPS Report Date: 05/04/26 |
|
|
|
| |