| Zacks Company Profile for WaFd, Inc. (WAFD : NSDQ) |
|
|
| |
| • Company Description |
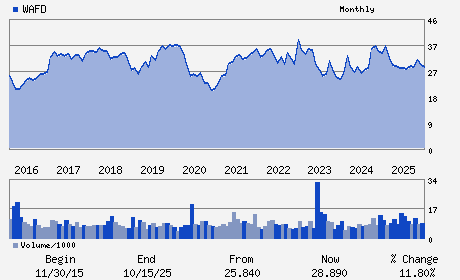
| WAFD INC operates as a bank holding company which provides lending, depository, insurance and other banking services principally in the United States. WAFD INC., formerly known as Washington Federal Inc., is based in Seattle, Washington.
Number of Employees: 2,037 |
|
|
| |
| • Price / Volume Information |
| Yesterday's Closing Price: $35.57 |
Daily Weekly Monthly
 |
| 20 Day Moving Average: 481,935 shares |
| Shares Outstanding: 73.89 (millions) |
| Market Capitalization: $2,628.21 (millions) |
| Beta: 0.84 |
| 52 Week High: $36.53 |
| 52 Week Low: $26.31 |
| Short Interest Ratio: |
| |
% Price Change |
% Price Change Relative to S&P 500 |
| 4 Week |
0.06% |
0.26% |
| 12 Week |
14.59% |
2.93% |
| Year To Date |
11.05% |
2.96% |
|
|
|
|
| |
|
|
| |
| • General Corporate Information |
Officers
Brent J. Beardall - Chief Executive Officer;President; Vice Chairman
Stephen M. Graham - Chairman of the Board
Kelli J. Holz - Executive Vice President and Chief Financial Offic
Blayne A. Sanden - Senior Vice President and Principal Accounting Off
R. Shawn Bice - Director
|
|
Peer Information
WaFd, Inc. (CACB)
WaFd, Inc. (CPF)
WaFd, Inc. (FMBL)
WaFd, Inc. (GRGN.)
WaFd, Inc. (EVRT)
WaFd, Inc. (EWBC)
|
|
Industry / Sector / Ticker Info
Analyst Coverage: No
Industry Group: BANKS-WEST
Sector: Finance
CUSIP: 938824109
SIC: 6021
|
|
Fiscal Year
Fiscal Year End: September
Last Reported Quarter: 03/01/26
Next Expected EPS Date: 07/16/26
|
|
Share - Related Items
Shares Outstanding: 73.89
Most Recent Split Date: 2.00 (1.10:1)
Beta: 0.84
Market Capitalization: $2,628.21 (millions)
|
|
|
|
|
| |
| • EPS Information |
• Dividend Information |
| Analyst Coverage: No |
Dividend Yield: 3.04% |
| Current Fiscal Quarter EPS Consensus Estimate: $0.83 |
Indicated Annual Dividend: $1.08 |
| Current Fiscal Year EPS Consensus Estimate: $3.27 |
Payout Ratio: 0.36 |
| Number of Estimates in the Fiscal Year Consensus: 3.00 |
Change In Payout Ratio: 0.02 |
| Estmated Long-Term EPS Growth Rate: % |
Last Dividend Paid: 05/22/2026 - $0.27 |
| Next EPS Report Date: 07/16/26 |
|
|
|
| |