| Zacks Company Profile for Woodside Energy Group Ltd (WDS : NYSE) |
|
|
| |
| • Company Description |
| Woodside Energy Group Ltd engages in the exploration, evaluation, development, production and marketing of hydrocarbons principally in the Asia Pacific, Africa, the Americas and the Europe. The company produces liquefied natural gas, pipeline gas, crude oil and condensate and natural gas liquids. Woodside Energy Group Ltd, formerly known as Woodside Petroleum Ltd, is based in Perth, Australia.
Number of Employees: |
|
|
| |
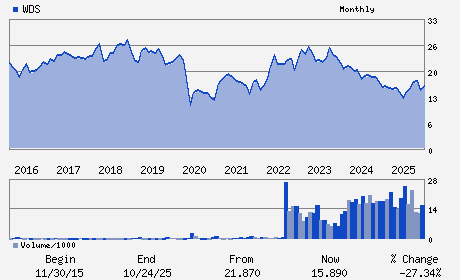
| • Price / Volume Information |
| Yesterday's Closing Price: $24.34 |
Daily Weekly Monthly
 |
| 20 Day Moving Average: 1,650,207 shares |
| Shares Outstanding: 1,901.10 (millions) |
| Market Capitalization: $46,272.78 (millions) |
| Beta: 0.38 |
| 52 Week High: $25.19 |
| 52 Week Low: $11.26 |
| Short Interest Ratio: |
| |
% Price Change |
% Price Change Relative to S&P 500 |
| 4 Week |
24.37% |
30.70% |
| 12 Week |
55.83% |
63.90% |
| Year To Date |
56.13% |
63.01% |
|
|
|
|
| |
| • Address & Contact Information |
| Street Address |
Phone / Fax |
Email Address |
Web URL |
Mia Yellagonga 11 Mount Street
-
Perth,C3 6000
AUS |
ph: 61-8-9348-4000
fax: 61-4-1047-1079 |
None |
http://www.woodside.com.au |
|
|
| |
| • General Corporate Information |
Officers
Marguerite O'Neill - Chief Executive Officer
Richard Goyder - Chairman
Larry Archibald - Director
Frank Cooper - Director
Swee Chen Goh - Director
|
|
Peer Information
Woodside Energy Group Ltd (APWR)
Woodside Energy Group Ltd (USFCQ)
Woodside Energy Group Ltd (SGII.)
Woodside Energy Group Ltd (APGI)
Woodside Energy Group Ltd (HYDP)
Woodside Energy Group Ltd (FCEL)
|
|
Industry / Sector / Ticker Info
Analyst Coverage: No
Industry Group: Other Alt Energy
Sector: Oils/Energy
CUSIP: 980228308
SIC: 1311
|
|
Fiscal Year
Fiscal Year End: December
Last Reported Quarter: -
Next Expected EPS Date: 05/25/26
|
|
Share - Related Items
Shares Outstanding: 1,901.10
Most Recent Split Date: (:1)
Beta: 0.38
Market Capitalization: $46,272.78 (millions)
|
|
|
|
|
| |
| • EPS Information |
• Dividend Information |
| Analyst Coverage: No |
Dividend Yield: 4.68% |
| Current Fiscal Quarter EPS Consensus Estimate: $ |
Indicated Annual Dividend: $1.14 |
| Current Fiscal Year EPS Consensus Estimate: $ |
Payout Ratio: |
| Number of Estimates in the Fiscal Year Consensus: |
Change In Payout Ratio: |
| Estmated Long-Term EPS Growth Rate: % |
Last Dividend Paid: 03/06/2026 - $0.57 |
| Next EPS Report Date: 05/25/26 |
|
|
|
| |