| Zacks Company Profile for The Wendy's Company (WEN : NSDQ) |
|
|
| |
| • Company Description |
| The Wendy's Company, the world's third-largest quick-service restaurant company, operates through Wendy's Restaurants, LLC, its subsidiary holding company. The fast-food chain through its subsidiary operates as a franchisor of the Wendy's restaurant system. Some significant changes in management & operations led to the combination of its Canadian business with its International segment and separating its real estate and development operations into its own segment. The company now operates under the following three segments, namely Wendy's U.S., Wendy's International and Global Real Estate & Development. It derives revenues from two principal sources: sales at company-operated restaurants and franchise-related revenues including royalties, national advertising funds contributions, rents and franchise fees received from Wendy's franchised restaurants.
Number of Employees: 14,900 |
|
|
| |
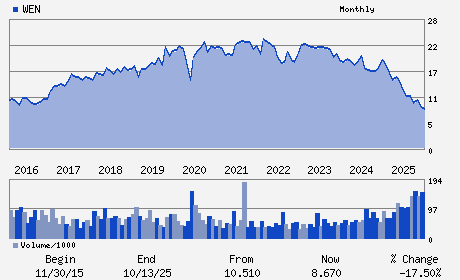
| • Price / Volume Information |
| Yesterday's Closing Price: $6.63 |
Daily Weekly Monthly
 |
| 20 Day Moving Average: 9,374,403 shares |
| Shares Outstanding: 190.48 (millions) |
| Market Capitalization: $1,262.89 (millions) |
| Beta: 0.38 |
| 52 Week High: $12.51 |
| 52 Week Low: $6.37 |
| Short Interest Ratio: |
| |
% Price Change |
% Price Change Relative to S&P 500 |
| 4 Week |
-19.05% |
-17.07% |
| 12 Week |
-5.15% |
-13.53% |
| Year To Date |
-20.41% |
-25.02% |
|
|
|
|
| |
|
|
| |
| • General Corporate Information |
Officers
Kenneth Cook - Interim Chief Executive Officer and Chief Financia
Arthur B. Winkleblack - Chairman
Peter W. May - Senior Vice Chairman and Director
Suzanne M. Thuerk - Chief Accounting Officer
Wendy C. Arlin - Director
|
|
Peer Information
The Wendy's Company (BH)
The Wendy's Company (BUCA)
The Wendy's Company (BUNZQ)
The Wendy's Company (FRRG)
The Wendy's Company (CHEF.)
The Wendy's Company (BGMTQ)
|
|
Industry / Sector / Ticker Info
Analyst Coverage: No
Industry Group: RETAIL-RESTRNTS
Sector: Retail/Wholesale
CUSIP: 95058W100
SIC: 5810
|
|
Fiscal Year
Fiscal Year End: December
Last Reported Quarter: 03/01/26
Next Expected EPS Date: 08/14/26
|
|
Share - Related Items
Shares Outstanding: 190.48
Most Recent Split Date: 4.00 (1.05:1)
Beta: 0.38
Market Capitalization: $1,262.89 (millions)
|
|
|
|
|
| |
| • EPS Information |
• Dividend Information |
| Analyst Coverage: No |
Dividend Yield: 8.45% |
| Current Fiscal Quarter EPS Consensus Estimate: $0.16 |
Indicated Annual Dividend: $0.56 |
| Current Fiscal Year EPS Consensus Estimate: $0.58 |
Payout Ratio: 0.69 |
| Number of Estimates in the Fiscal Year Consensus: 9.00 |
Change In Payout Ratio: -0.10 |
| Estmated Long-Term EPS Growth Rate: 23.87% |
Last Dividend Paid: 06/01/2026 - $0.14 |
| Next EPS Report Date: 08/14/26 |
|
|
|
| |