| Zacks Company Profile for Wrap Technologies, Inc. (WRAP : NSDQ) |
|
|
| |
| • Company Description |
| Wrap Reality, the Company's virtual reality training system, is a fully immersive training simulator and comprehensive public safety training platform providing first responders with the discipline and practice in methods of de-escalation, conflict resolution, and use-of-force to better perform in the field. WRAP's headquarters are in Tempe, Arizona.
Number of Employees: 19 |
|
|
| |
| • Price / Volume Information |
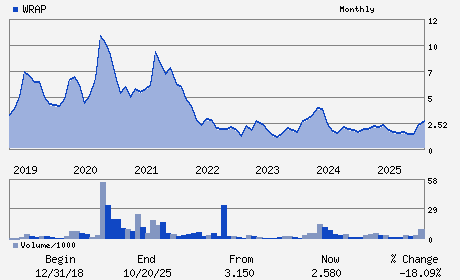
| Yesterday's Closing Price: $1.46 |
Daily Weekly Monthly
 |
| 20 Day Moving Average: 246,808 shares |
| Shares Outstanding: 54.50 (millions) |
| Market Capitalization: $79.57 (millions) |
| Beta: 1.51 |
| 52 Week High: $3.23 |
| 52 Week Low: $1.20 |
| Short Interest Ratio: |
| |
% Price Change |
% Price Change Relative to S&P 500 |
| 4 Week |
-17.98% |
-13.50% |
| 12 Week |
-32.41% |
-27.99% |
| Year To Date |
-38.66% |
-34.26% |
|
|
|
|
| |
| • Address & Contact Information |
| Street Address |
Phone / Fax |
Email Address |
Web URL |
3480 Main Hwy Suite 202
-
Miami,FL 33133
USA |
ph: 800-583-2652
fax: - |
ir@wrap.com |
http://www.wrap.com |
|
|
| |
| • General Corporate Information |
Officers
Scot Cohen - Chief Executive Officer
Bruce Bernstein - Director
Marc Savas - Director
Rajiv Srinivasan - Director
Timothy Szymanski - Director
|
|
Peer Information
Wrap Technologies, Inc. (BRC)
Wrap Technologies, Inc. (ALGI)
Wrap Technologies, Inc. (SYNX.)
Wrap Technologies, Inc. (ADSV)
Wrap Technologies, Inc. (CDCY)
Wrap Technologies, Inc. (CSCQ)
|
|
Industry / Sector / Ticker Info
Analyst Coverage: No
Industry Group: PROTECTION-SFTY
Sector: Industrial Products
CUSIP: 98212N107
SIC: 3480
|
|
Fiscal Year
Fiscal Year End: December
Last Reported Quarter: 09/01/25
Next Expected EPS Date: 03/30/26
|
|
Share - Related Items
Shares Outstanding: 54.50
Most Recent Split Date: (:1)
Beta: 1.51
Market Capitalization: $79.57 (millions)
|
|
|
|
|
| |
| • EPS Information |
• Dividend Information |
| Analyst Coverage: No |
Dividend Yield: 0.00% |
| Current Fiscal Quarter EPS Consensus Estimate: $ |
Indicated Annual Dividend: $0.00 |
| Current Fiscal Year EPS Consensus Estimate: $ |
Payout Ratio: |
| Number of Estimates in the Fiscal Year Consensus: |
Change In Payout Ratio: |
| Estmated Long-Term EPS Growth Rate: % |
Last Dividend Paid: NA - $0.00 |
| Next EPS Report Date: 03/30/26 |
|
|
|
| |