| Zacks Company Profile for WSB Financial Group Inc. (WSFGQ : OTC) |
|
|
| |
| • Company Description |
| WSB FINANCIAL GROUP, INC. is a bank holding company that operates through its wholly owned subsidiary, Westsound Bank, in nine banking locations in Bremerton, Silverdale, Gig Harbor, Port Orchard, Poulsbo, Sequim, Federal Way, Port Townsend and Port Angeles. All locations are within the State of Washington. It provides banking services throughout its primary market area to real estate developers, contractors and small to medium-sized businesses in its market. Westsound Bank also provides a range of banking services and products to individuals, including personal checking and savings accounts and other consumer banking products, including electronic banking.
Number of Employees: |
|
|
| |
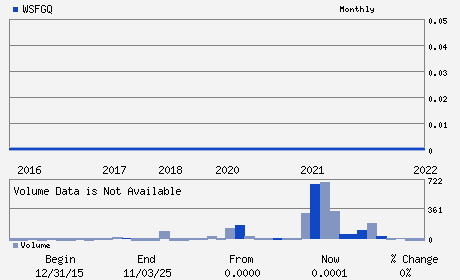
| • Price / Volume Information |
| Yesterday's Closing Price: $ |
Daily Weekly Monthly
 |
| 20 Day Moving Average: shares |
| Shares Outstanding: (millions) |
| Market Capitalization: $ (millions) |
| Beta: |
| 52 Week High: $0.00 |
| 52 Week Low: $0.00 |
| Short Interest Ratio: |
| |
% Price Change |
% Price Change Relative to S&P 500 |
| 4 Week |
% |
% |
| 12 Week |
% |
% |
| Year To Date |
% |
% |
|
|
|
|
| |
| • Address & Contact Information |
| Street Address |
Phone / Fax |
Email Address |
Web URL |
607 PACIFIC AVENUE
-
BREMERTON,WA 98337
USA |
ph: 360-405-1200
fax: 360-405-1206 |
None |
http://www.westsoundbank.com |
|
|
| |
| • General Corporate Information |
Officers
Donald F. Cox, Jr. - Chairman and Director
Terry A. Peterson - President and C.E.O.
Mark D. Freeman - Exec.V.P.and C.F.O.
Janet M. Hobson - Vice President; C.A.O
Richard N. Christopherson - Director
|
|
Peer Information
- (-)
- (-)
- (-)
- (-)
- (-)
- (-)
|
|
Industry / Sector / Ticker Info
Analyst Coverage: No
Industry Group: BANKS-WEST
Sector: Finance
CUSIP: 92933E108
SIC: 6022
|
|
Fiscal Year
Fiscal Year End: December
Last Reported Quarter: -
Next Expected EPS Date: -
|
|
Share - Related Items
Shares Outstanding:
Most Recent Split Date: (:1)
Beta:
Market Capitalization: $ (millions)
|
|
|
|
|
| |
| • EPS Information |
• Dividend Information |
| Analyst Coverage: No |
Dividend Yield: % |
| Current Fiscal Quarter EPS Consensus Estimate: $ |
Indicated Annual Dividend: $0.00 |
| Current Fiscal Year EPS Consensus Estimate: $ |
Payout Ratio: |
| Number of Estimates in the Fiscal Year Consensus: |
Change In Payout Ratio: |
| Estmated Long-Term EPS Growth Rate: % |
Last Dividend Paid: NA - $0.00 |
| Next EPS Report Date: - |
|
|
|
| |