| Zacks Company Profile for Xponential Fitness, Inc. (XPOF : NYSE) |
|
|
| |
| • Company Description |
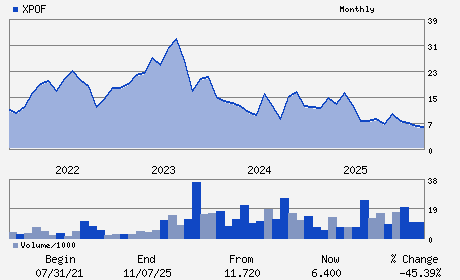
| Xponential Fitness Inc. is a curator of boutique fitness brands across multiple verticals. The company built and curated a diversified platform of boutique fitness brands spanning across verticals including Pilates, indoor cycling, barre, stretching, rowing, dancing, boxing, running and yoga. Its portfolio of brands includes Club Pilates, CycleBar, StretchLab, Row House, AKT, YogaSix and STRIDE. Xponential Fitness Inc. is headquartered in Irvine, California.
Number of Employees: 340 |
|
|
| |
| • Price / Volume Information |
| Yesterday's Closing Price: $5.66 |
Daily Weekly Monthly
 |
| 20 Day Moving Average: 969,830 shares |
| Shares Outstanding: 49.05 (millions) |
| Market Capitalization: $277.62 (millions) |
| Beta: 1.48 |
| 52 Week High: $11.14 |
| 52 Week Low: $3.83 |
| Short Interest Ratio: |
| |
% Price Change |
% Price Change Relative to S&P 500 |
| 4 Week |
-31.81% |
-30.42% |
| 12 Week |
-29.25% |
-27.36% |
| Year To Date |
-31.23% |
-29.73% |
|
|
|
|
| |
|
|
| |
| • General Corporate Information |
Officers
Michael Nuzzo - Chief Executive Officer and Director
Mark Grabowski - Chairman of the Board
John Meloun - Chief Financial Officer
Bruce N. Haase - Director
Rachel H. Lee - Director
|
|
Peer Information
Xponential Fitness, Inc. (KJFI)
Xponential Fitness, Inc. (MBEW)
Xponential Fitness, Inc. (DVD)
Xponential Fitness, Inc. (GCCXQ)
Xponential Fitness, Inc. (AMIEQ)
Xponential Fitness, Inc. (FAIR)
|
|
Industry / Sector / Ticker Info
Analyst Coverage: No
Industry Group: LEISURE&REC SVS
Sector: Consumer Discretionary
CUSIP: 98422X101
SIC: 7990
|
|
Fiscal Year
Fiscal Year End: December
Last Reported Quarter: 12/01/25
Next Expected EPS Date: 05/14/26
|
|
Share - Related Items
Shares Outstanding: 49.05
Most Recent Split Date: (:1)
Beta: 1.48
Market Capitalization: $277.62 (millions)
|
|
|
|
|
| |
| • EPS Information |
• Dividend Information |
| Analyst Coverage: No |
Dividend Yield: 0.00% |
| Current Fiscal Quarter EPS Consensus Estimate: $0.10 |
Indicated Annual Dividend: $0.00 |
| Current Fiscal Year EPS Consensus Estimate: $0.51 |
Payout Ratio: 0.00 |
| Number of Estimates in the Fiscal Year Consensus: 4.00 |
Change In Payout Ratio: |
| Estmated Long-Term EPS Growth Rate: % |
Last Dividend Paid: NA - $0.00 |
| Next EPS Report Date: 05/14/26 |
|
|
|
| |