| Zacks Company Profile for Zedge, Inc. (ZDGE : AMEX) |
|
|
| |
| • Company Description |
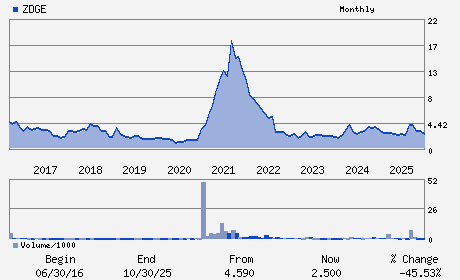
| Zedge, Inc. offers content distribution platforms for both creators and consumers. The Company enables consumers to personalize their mobile devices with free ringtones, wallpapers, home screen application icons and notification sounds. Zedge, Inc. is based in New York, United States.
Number of Employees: 82 |
|
|
| |
| • Price / Volume Information |
| Yesterday's Closing Price: $2.76 |
Daily Weekly Monthly
 |
| 20 Day Moving Average: 77,801 shares |
| Shares Outstanding: 12.52 (millions) |
| Market Capitalization: $34.55 (millions) |
| Beta: 1.35 |
| 52 Week High: $4.89 |
| 52 Week Low: $1.73 |
| Short Interest Ratio: |
| |
% Price Change |
% Price Change Relative to S&P 500 |
| 4 Week |
-10.10% |
-2.47% |
| 12 Week |
-27.56% |
-21.18% |
| Year To Date |
-15.85% |
-9.20% |
|
|
|
|
| |
| • Address & Contact Information |
| Street Address |
Phone / Fax |
Email Address |
Web URL |
1178 BROADWAY 3RD FLOOR
-
NEW YORK,NY 10001
USA |
ph: 330-577-3424
fax: - |
ir@zedge.net |
http://www.zedge.net |
|
|
| |
| • General Corporate Information |
Officers
Jonathan Reich - Chief Executive Officer
Yi Tsai - Chief Financial Officer
Michael Jonas - Director
Howard S. Jonas - Director
Mark Ghermezian - Director
|
|
Peer Information
Zedge, Inc. (HHNT)
Zedge, Inc. (CDCAQ)
Zedge, Inc. (IPIXQ)
Zedge, Inc. (CNET.)
Zedge, Inc. (DTHK)
Zedge, Inc. (ADAM.)
|
|
Industry / Sector / Ticker Info
Analyst Coverage: No
Industry Group: INTERNET CONTENT
Sector: Computer and Technology
CUSIP: 98923T104
SIC: 7372
|
|
Fiscal Year
Fiscal Year End: July
Last Reported Quarter: 01/01/26
Next Expected EPS Date: 06/11/26
|
|
Share - Related Items
Shares Outstanding: 12.52
Most Recent Split Date: (:1)
Beta: 1.35
Market Capitalization: $34.55 (millions)
|
|
|
|
|
| |
| • EPS Information |
• Dividend Information |
| Analyst Coverage: No |
Dividend Yield: 2.32% |
| Current Fiscal Quarter EPS Consensus Estimate: $ |
Indicated Annual Dividend: $0.06 |
| Current Fiscal Year EPS Consensus Estimate: $ |
Payout Ratio: 0.34 |
| Number of Estimates in the Fiscal Year Consensus: |
Change In Payout Ratio: 0.29 |
| Estmated Long-Term EPS Growth Rate: % |
Last Dividend Paid: 01/30/2026 - $0.02 |
| Next EPS Report Date: 06/11/26 |
|
|
|
| |