| Zacks Company Profile for AAON, Inc. (AAON : NSDQ) |
|
|
| |
| • Company Description |
| Aaon Inc. is a manufacturer of air-conditioning and heating equipment consisting of rooftop units, chillers, air-handling units, condensing units and coils. Its products serve the new construction and replacement markets. The Company has successfully gained market share through its semi-custom product lines, which offer the customer value, quality, function, serviceability and efficiency.
Number of Employees: 5,897 |
|
|
| |
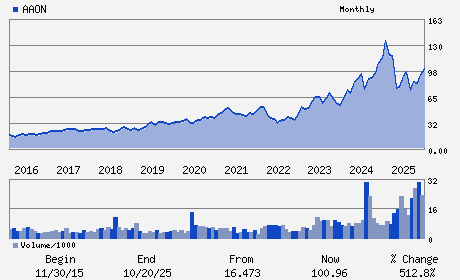
| • Price / Volume Information |
| Yesterday's Closing Price: $134.60 |
Daily Weekly Monthly
 |
| 20 Day Moving Average: 1,471,167 shares |
| Shares Outstanding: 81.91 (millions) |
| Market Capitalization: $11,025.36 (millions) |
| Beta: 1.24 |
| 52 Week High: $149.00 |
| 52 Week Low: $62.00 |
| Short Interest Ratio: |
| |
% Price Change |
% Price Change Relative to S&P 500 |
| 4 Week |
36.36% |
29.70% |
| 12 Week |
36.11% |
25.83% |
| Year To Date |
76.52% |
59.63% |
|
|
|
|
| |
|
|
| |
| • General Corporate Information |
Officers
Matthew J. Tobolski - Chief Executive Officer and Director
Rebecca A. Thompson - Chief Financial Officer
Rebecca A. Thompson - Principal Accounting Officer
Norman H. Asbjornson - Director
Gary D. Fields - Director
|
|
Peer Information
AAON, Inc. (CCOM.)
AAON, Inc. (KGSPY)
AAON, Inc. (FBIN)
AAON, Inc. (LII)
AAON, Inc. (SPXC)
AAON, Inc. (MTINQ)
|
|
Industry / Sector / Ticker Info
Analyst Coverage: No
Industry Group: BLDG PRD-AIR/HT
Sector: Construction
CUSIP: 000360206
SIC: 3585
|
|
Fiscal Year
Fiscal Year End: December
Last Reported Quarter: 03/01/26
Next Expected EPS Date: 08/10/26
|
|
Share - Related Items
Shares Outstanding: 81.91
Most Recent Split Date: 8.00 (1.50:1)
Beta: 1.24
Market Capitalization: $11,025.36 (millions)
|
|
|
|
|
| |
| • EPS Information |
• Dividend Information |
| Analyst Coverage: No |
Dividend Yield: 0.30% |
| Current Fiscal Quarter EPS Consensus Estimate: $0.50 |
Indicated Annual Dividend: $0.40 |
| Current Fiscal Year EPS Consensus Estimate: $2.23 |
Payout Ratio: 0.27 |
| Number of Estimates in the Fiscal Year Consensus: 3.00 |
Change In Payout Ratio: 0.04 |
| Estmated Long-Term EPS Growth Rate: 16.00% |
Last Dividend Paid: 03/18/2026 - $0.10 |
| Next EPS Report Date: 08/10/26 |
|
|
|
| |