| Zacks Company Profile for C3.ai, Inc. (AI : NYSE) |
|
|
| |
| • Company Description |
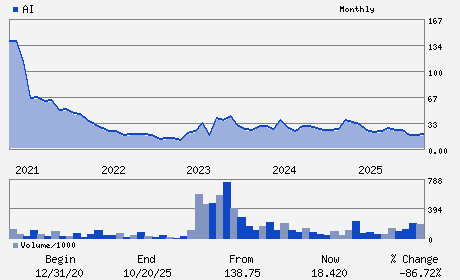
| C3.ai Inc. is an enterprise AI software provider for accelerating digital transformation. C3.ai delivers the C3 AI Suite for developing, deploying and operating large-scale AI, predictive analytics and IoT applications. The core of the C3.ai offering is a proprietary, model-driven AI architecture which enhances data science and application development. C3.ai is based in Redwood City, United States.
Number of Employees: 1,181 |
|
|
| |
| • Price / Volume Information |
| Yesterday's Closing Price: $9.52 |
Daily Weekly Monthly
 |
| 20 Day Moving Average: 4,598,672 shares |
| Shares Outstanding: 145.29 (millions) |
| Market Capitalization: $1,383.17 (millions) |
| Beta: 2.08 |
| 52 Week High: $30.24 |
| 52 Week Low: $7.68 |
| Short Interest Ratio: |
| |
% Price Change |
% Price Change Relative to S&P 500 |
| 4 Week |
10.57% |
4.30% |
| 12 Week |
-24.56% |
-26.15% |
| Year To Date |
-29.38% |
-31.16% |
|
|
|
|
| |
| • Address & Contact Information |
| Street Address |
Phone / Fax |
Email Address |
Web URL |
1400 Seaport Blvd
-
Redwood City,CA 94063
USA |
ph: 650-503-2200
fax: - |
ir@c3.ai |
http://www.c3.ai |
|
|
| |
| • General Corporate Information |
Officers
Thomas M. Siebel - Chief Executive Officer and Chairman of the Board
Hitesh Lath - Senior Vice President and Chief Financial Officer
Lisa A. Davis - Director
Richard C. Levin - Director
Michael G. McCaffery - Director
|
|
Peer Information
C3.ai, Inc. (UIS)
C3.ai, Inc. (CTSH)
C3.ai, Inc. (ASGN)
C3.ai, Inc. (GTTNQ)
C3.ai, Inc. (DXC)
C3.ai, Inc. (DOX)
|
|
Industry / Sector / Ticker Info
Analyst Coverage: No
Industry Group: IT Services
Sector: Computer and Technology
CUSIP: 12468P104
SIC: 7372
|
|
Fiscal Year
Fiscal Year End: April
Last Reported Quarter: 01/01/26
Next Expected EPS Date: 05/27/26
|
|
Share - Related Items
Shares Outstanding: 145.29
Most Recent Split Date: (:1)
Beta: 2.08
Market Capitalization: $1,383.17 (millions)
|
|
|
|
|
| |
| • EPS Information |
• Dividend Information |
| Analyst Coverage: No |
Dividend Yield: 0.00% |
| Current Fiscal Quarter EPS Consensus Estimate: $-0.75 |
Indicated Annual Dividend: $0.00 |
| Current Fiscal Year EPS Consensus Estimate: $-3.22 |
Payout Ratio: |
| Number of Estimates in the Fiscal Year Consensus: 6.00 |
Change In Payout Ratio: |
| Estmated Long-Term EPS Growth Rate: % |
Last Dividend Paid: NA - $0.00 |
| Next EPS Report Date: 05/27/26 |
|
|
|
| |