| Zacks Company Profile for AstroNova, Inc. (ALOT : NSDQ) |
|
|
| |
| • Company Description |
| AstroNova, Inc. provides data visualization technologies. The company designs, manufactures, distributes and services products which acquire, store, analyze and present data in multiple formats. The Product Identification segment offers hardware and software products and associated consumables. Test and Measurement segment includes suite of products and services which acquire and record electronic signal data from local and networked sensors. Its brand includes QuickLabel(R). AstroNova, Inc., formerly known as Astro-Med, Inc., is based in WEST WARWICK, United States.
Number of Employees: 398 |
|
|
| |
| • Price / Volume Information |
| Yesterday's Closing Price: $14.23 |
Daily Weekly Monthly
 |
| 20 Day Moving Average: 37,632 shares |
| Shares Outstanding: 7.69 (millions) |
| Market Capitalization: $109.47 (millions) |
| Beta: 0.95 |
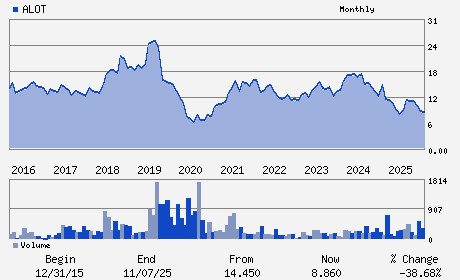
| 52 Week High: $15.08 |
| 52 Week Low: $6.96 |
| Short Interest Ratio: |
| |
% Price Change |
% Price Change Relative to S&P 500 |
| 4 Week |
3.27% |
-1.78% |
| 12 Week |
55.52% |
43.77% |
| Year To Date |
64.51% |
50.72% |
|
|
|
|
| |
|
|
| |
| • General Corporate Information |
Officers
Jorik E. Ittmann - Chief Executive Officer;President
Darius G. Nevin - Executive Chairman
Thomas D. DeByle - Chief Financial Officer;Vice President
Padraig Finn - Senior Vice President
Michael J. Natalizia - Vice President
|
|
Peer Information
AstroNova, Inc. (EVOL)
AstroNova, Inc. (RAMP)
AstroNova, Inc. (EFOR)
AstroNova, Inc. (LGTY)
AstroNova, Inc. (ALOT)
AstroNova, Inc. (CXT)
|
|
Industry / Sector / Ticker Info
Analyst Coverage: No
Industry Group: Technology Services
Sector: Business Services
CUSIP: 04638F108
SIC: 3577
|
|
Fiscal Year
Fiscal Year End: January
Last Reported Quarter: 01/01/26
Next Expected EPS Date: 06/04/26
|
|
Share - Related Items
Shares Outstanding: 7.69
Most Recent Split Date: 7.00 (1.25:1)
Beta: 0.95
Market Capitalization: $109.47 (millions)
|
|
|
|
|
| |
| • EPS Information |
• Dividend Information |
| Analyst Coverage: No |
Dividend Yield: 0.00% |
| Current Fiscal Quarter EPS Consensus Estimate: $ |
Indicated Annual Dividend: $0.00 |
| Current Fiscal Year EPS Consensus Estimate: $ |
Payout Ratio: 0.00 |
| Number of Estimates in the Fiscal Year Consensus: |
Change In Payout Ratio: 0.00 |
| Estmated Long-Term EPS Growth Rate: % |
Last Dividend Paid: NA - $0.00 |
| Next EPS Report Date: 06/04/26 |
|
|
|
| |