| Zacks Company Profile for Alstom ADR (ALSMY : OTC) |
|
|
| |
| • Company Description |
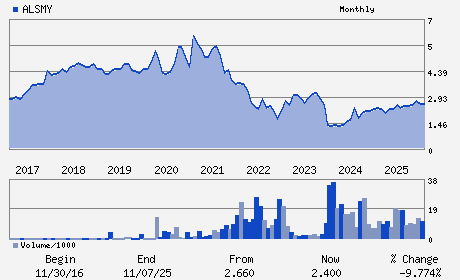
| Alstom SA develops and markets systems, equipment and services for the railway sector. Its product includes bogies, traction systems, electrification, track laying and urban integrated solution. It also offers services such as parts and repairs, maintenance, customisation, modernisation and support services. Alstom SA is headquartered in France.
Number of Employees: 86,039 |
|
|
| |
| • Price / Volume Information |
| Yesterday's Closing Price: $1.91 |
Daily Weekly Monthly
 |
| 20 Day Moving Average: 2,467,072 shares |
| Shares Outstanding: 4,620.30 (millions) |
| Market Capitalization: $8,824.77 (millions) |
| Beta: 1.02 |
| 52 Week High: $3.51 |
| 52 Week Low: $1.84 |
| Short Interest Ratio: |
| |
% Price Change |
% Price Change Relative to S&P 500 |
| 4 Week |
-0.52% |
-5.38% |
| 12 Week |
-41.95% |
-46.33% |
| Year To Date |
-34.36% |
-39.97% |
|
|
|
|
| |
|
|
| |
| • General Corporate Information |
Officers
Henri Poupart-Lafarge - Chief Executive Officer and Director
Danny Di Perna - Executive VP & COO
Bernard-Pierre Delpit - Executive VP & CFO
Ms. Dana Salloum - Chief Communications Officer
Emmanuelle Petrovic - General Counsel
|
|
Peer Information
Alstom ADR (ABCRQ)
Alstom ADR (RVSN)
Alstom ADR (CP)
Alstom ADR (FLA)
Alstom ADR (GSHHY)
Alstom ADR (BNI)
|
|
Industry / Sector / Ticker Info
Analyst Coverage: No
Industry Group: TRANS-RAIL
Sector: Transportation
CUSIP: 021244207
SIC: 3621
|
|
Fiscal Year
Fiscal Year End: March
Last Reported Quarter: -
Next Expected EPS Date: -
|
|
Share - Related Items
Shares Outstanding: 4,620.30
Most Recent Split Date: (:1)
Beta: 1.02
Market Capitalization: $8,824.77 (millions)
|
|
|
|
|
| |
| • EPS Information |
• Dividend Information |
| Analyst Coverage: No |
Dividend Yield: 0.00% |
| Current Fiscal Quarter EPS Consensus Estimate: $ |
Indicated Annual Dividend: $0.00 |
| Current Fiscal Year EPS Consensus Estimate: $0.18 |
Payout Ratio: |
| Number of Estimates in the Fiscal Year Consensus: 1.00 |
Change In Payout Ratio: |
| Estmated Long-Term EPS Growth Rate: % |
Last Dividend Paid: NA - $0.00 |
| Next EPS Report Date: - |
|
|
|
| |