| Zacks Company Profile for Alexander's, Inc. (ALX : NYSE) |
|
|
| |
| • Company Description |
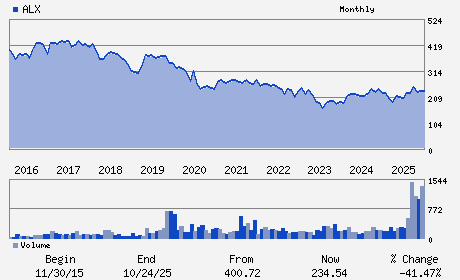
| Alexander's, Inc. is a real estate investment trust engaged in leasing, managing, developing and redeveloping properties. Alexander's activities are conducted through its manager, Vornado Realty Trust.
Number of Employees: 103 |
|
|
| |
| • Price / Volume Information |
| Yesterday's Closing Price: $246.22 |
Daily Weekly Monthly
 |
| 20 Day Moving Average: 47,112 shares |
| Shares Outstanding: 5.11 (millions) |
| Market Capitalization: $1,257.52 (millions) |
| Beta: 0.80 |
| 52 Week High: $260.84 |
| 52 Week Low: $201.28 |
| Short Interest Ratio: |
| |
% Price Change |
% Price Change Relative to S&P 500 |
| 4 Week |
0.07% |
-4.82% |
| 12 Week |
1.41% |
-6.25% |
| Year To Date |
12.98% |
5.48% |
|
|
|
|
| |
| • Address & Contact Information |
| Street Address |
Phone / Fax |
Email Address |
Web URL |
210 ROUTE 4 EAST
-
PARAMUS,NJ 07652
USA |
ph: 201-587-8541
fax: 201-708-6214 |
None |
http://www.alx-inc.com |
|
|
| |
| • General Corporate Information |
Officers
Steven Roth - Chief Executive Officer and Chairman of the Board
Gary Hansen - Chief Financial Officer
Thomas R. DiBenedetto - Director
David Mandelbaum - Director
Mandakini Puri - Director
|
|
Peer Information
Alexander's, Inc. (ARE)
Alexander's, Inc. (CUZ)
Alexander's, Inc. (FUR)
Alexander's, Inc. (NNN)
Alexander's, Inc. (FCH)
Alexander's, Inc. (CTO)
|
|
Industry / Sector / Ticker Info
Analyst Coverage: No
Industry Group: REIT-EQTY TRUST -OTHER
Sector: Finance
CUSIP: 014752109
SIC: 6798
|
|
Fiscal Year
Fiscal Year End: December
Last Reported Quarter: 03/01/26
Next Expected EPS Date: 08/03/26
|
|
Share - Related Items
Shares Outstanding: 5.11
Most Recent Split Date: (:1)
Beta: 0.80
Market Capitalization: $1,257.52 (millions)
|
|
|
|
|
| |
| • EPS Information |
• Dividend Information |
| Analyst Coverage: No |
Dividend Yield: 7.31% |
| Current Fiscal Quarter EPS Consensus Estimate: $2.99 |
Indicated Annual Dividend: $18.00 |
| Current Fiscal Year EPS Consensus Estimate: $12.08 |
Payout Ratio: 1.66 |
| Number of Estimates in the Fiscal Year Consensus: 1.00 |
Change In Payout Ratio: 0.50 |
| Estmated Long-Term EPS Growth Rate: % |
Last Dividend Paid: 05/11/2026 - $9.00 |
| Next EPS Report Date: 08/03/26 |
|
|
|
| |