| Zacks Company Profile for American Homes 4 Rent (AMH : NYSE) |
|
|
| |
| • Company Description |
| American Homes 4 Rent is an internally managed real estate investment trust. It is focused on acquiring, renovating, leasing, and operating single-family homes as rental properties. It rents residential properties primarily in Arizona, California, Florida, Georgia, and Nevada. American Homes 4 Rent is based in Malibu, California.
Number of Employees: 1,598 |
|
|
| |
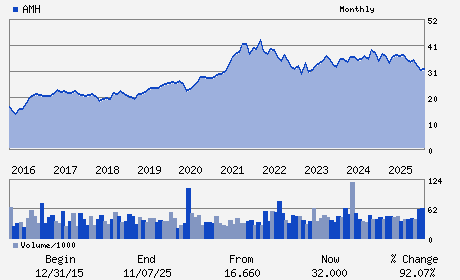
| • Price / Volume Information |
| Yesterday's Closing Price: $32.27 |
Daily Weekly Monthly
 |
| 20 Day Moving Average: 3,644,170 shares |
| Shares Outstanding: 360.60 (millions) |
| Market Capitalization: $11,636.43 (millions) |
| Beta: 0.82 |
| 52 Week High: $38.01 |
| 52 Week Low: $27.22 |
| Short Interest Ratio: |
| |
% Price Change |
% Price Change Relative to S&P 500 |
| 4 Week |
5.42% |
0.27% |
| 12 Week |
6.33% |
-1.71% |
| Year To Date |
0.53% |
-8.03% |
|
|
|
|
| |
| • Address & Contact Information |
| Street Address |
Phone / Fax |
Email Address |
Web URL |
280 Pilot Road
-
Las Vegas,NV 89119
USA |
ph: 805-413-5300
fax: - |
investors@amh.com |
http://www.amh.com |
|
|
| |
| • General Corporate Information |
Officers
Bryan Smith - Chief Executive Officer and Trustee
Chris Lau - Chief Financial Officer and Senior Executive Vice
Brian Reitz - Executive Vice President; Chief Accounting Officer
Douglas Benham - Trustee
Jack Corrigan - Trustee
|
|
Peer Information
American Homes 4 Rent (CPT)
American Homes 4 Rent (BHM)
American Homes 4 Rent (EQR)
American Homes 4 Rent (SAFE)
American Homes 4 Rent (AEC)
American Homes 4 Rent (VRE)
|
|
Industry / Sector / Ticker Info
Analyst Coverage: No
Industry Group: REIT-EQTY TRUST - RESID
Sector: Finance
CUSIP: 02665T306
SIC: 6798
|
|
Fiscal Year
Fiscal Year End: December
Last Reported Quarter: 03/01/26
Next Expected EPS Date: 07/30/26
|
|
Share - Related Items
Shares Outstanding: 360.60
Most Recent Split Date: (:1)
Beta: 0.82
Market Capitalization: $11,636.43 (millions)
|
|
|
|
|
| |
| • EPS Information |
• Dividend Information |
| Analyst Coverage: No |
Dividend Yield: 4.09% |
| Current Fiscal Quarter EPS Consensus Estimate: $0.48 |
Indicated Annual Dividend: $1.32 |
| Current Fiscal Year EPS Consensus Estimate: $1.93 |
Payout Ratio: 0.70 |
| Number of Estimates in the Fiscal Year Consensus: 7.00 |
Change In Payout Ratio: 0.16 |
| Estmated Long-Term EPS Growth Rate: 3.94% |
Last Dividend Paid: 03/13/2026 - $0.33 |
| Next EPS Report Date: 07/30/26 |
|
|
|
| |