| Zacks Company Profile for AvePoint, Inc. (AVPT : NSDQ) |
|
|
| |
| • Company Description |
| AvePoint Inc. is a data management solutions provider. AvePoint Inc., formerly known as Apex Technology Acquisition Corporation, is based in JERSEY CITY, N.J.
Number of Employees: 3,443 |
|
|
| |
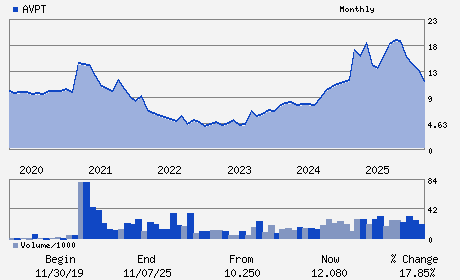
| • Price / Volume Information |
| Yesterday's Closing Price: $9.97 |
Daily Weekly Monthly
 |
| 20 Day Moving Average: 1,500,206 shares |
| Shares Outstanding: 215.47 (millions) |
| Market Capitalization: $2,147.12 (millions) |
| Beta: 1.20 |
| 52 Week High: $20.25 |
| 52 Week Low: $8.84 |
| Short Interest Ratio: |
| |
% Price Change |
% Price Change Relative to S&P 500 |
| 4 Week |
-4.55% |
-10.44% |
| 12 Week |
-20.34% |
-21.79% |
| Year To Date |
-28.26% |
-30.25% |
|
|
|
|
| |
| • Address & Contact Information |
| Street Address |
Phone / Fax |
Email Address |
Web URL |
525 WASHINGTON BLVD SUITE 1400
-
JERSEY CITY,NJ 07310
USA |
ph: 804-314-5903
fax: - |
ir@avepoint.com |
http://www.avepoint.com |
|
|
| |
| • General Corporate Information |
Officers
Tianyi Jiang - Chief Executive Officer
Xunkai Gong - Executive Chairman
James Caci - Chief Financial Officer
Brian Michael Brown - Chief Legal and Compliance Officer; Secretary
Jeff Teper - Director
|
|
Peer Information
AvePoint, Inc. (ADP)
AvePoint, Inc. (CWLD)
AvePoint, Inc. (CYBA.)
AvePoint, Inc. (ZVLO)
AvePoint, Inc. (AZPN)
AvePoint, Inc. (ATIS)
|
|
Industry / Sector / Ticker Info
Analyst Coverage: No
Industry Group: INTERNET SOFTWARE
Sector: Computer and Technology
CUSIP: 053604104
SIC: 7372
|
|
Fiscal Year
Fiscal Year End: December
Last Reported Quarter: 12/01/25
Next Expected EPS Date: 05/14/26
|
|
Share - Related Items
Shares Outstanding: 215.47
Most Recent Split Date: (:1)
Beta: 1.20
Market Capitalization: $2,147.12 (millions)
|
|
|
|
|
| |
| • EPS Information |
• Dividend Information |
| Analyst Coverage: No |
Dividend Yield: 0.00% |
| Current Fiscal Quarter EPS Consensus Estimate: $0.03 |
Indicated Annual Dividend: $0.00 |
| Current Fiscal Year EPS Consensus Estimate: $0.16 |
Payout Ratio: 0.00 |
| Number of Estimates in the Fiscal Year Consensus: 4.00 |
Change In Payout Ratio: |
| Estmated Long-Term EPS Growth Rate: % |
Last Dividend Paid: NA - $0.00 |
| Next EPS Report Date: 05/14/26 |
|
|
|
| |