| Zacks Company Profile for Banc of California, Inc. (BANC : NYSE) |
|
|
| |
| • Company Description |
| Banc of California, Inc. provides comprehensive banking services to California's diverse private businesses, entrepreneurs and homeowners. It is the parent company of Banc of California, National Association.
Number of Employees: 1,904 |
|
|
| |
| • Price / Volume Information |
| Yesterday's Closing Price: $18.81 |
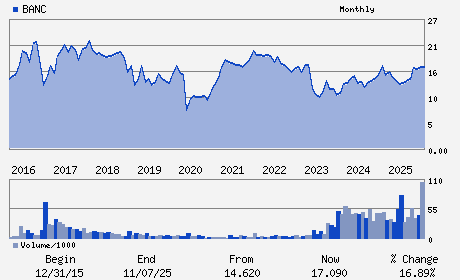
Daily Weekly Monthly
 |
| 20 Day Moving Average: 2,764,442 shares |
| Shares Outstanding: 154.20 (millions) |
| Market Capitalization: $2,900.54 (millions) |
| Beta: 0.75 |
| 52 Week High: $21.61 |
| 52 Week Low: $13.24 |
| Short Interest Ratio: |
| |
% Price Change |
% Price Change Relative to S&P 500 |
| 4 Week |
-0.48% |
-5.34% |
| 12 Week |
-4.90% |
-12.09% |
| Year To Date |
-2.49% |
-10.35% |
|
|
|
|
| |
| • Address & Contact Information |
| Street Address |
Phone / Fax |
Email Address |
Web URL |
11611 San Vicente Boulevard Suite 500
-
Los Angeles,CA 90049
USA |
ph: 855-361-2262
fax: 619-691-1350 |
ir@bancofcal.com |
http://www.bancofcal.com |
|
|
| |
| • General Corporate Information |
Officers
Jared M. Wolff - Chairman of the Board of Directors; President and
John M. Eggemeyer, III - Vice Chairman of the Board of Directors
Joseph Kauder - Executive Vice President and Chief Financial Offic
Karen Hon - Executive Vice President and Chief Accounting Offi
Paul R. Burke - Director
|
|
Peer Information
Banc of California, Inc. (FBA)
Banc of California, Inc. (FVNB)
Banc of California, Inc. (FSNMQ)
Banc of California, Inc. (SRYPQ)
Banc of California, Inc. (BOKF)
Banc of California, Inc. (FHN)
|
|
Industry / Sector / Ticker Info
Analyst Coverage: No
Industry Group: BANKS-SOUTHWEST
Sector: Finance
CUSIP: 05990K106
SIC: 6021
|
|
Fiscal Year
Fiscal Year End: December
Last Reported Quarter: 03/01/26
Next Expected EPS Date: 07/22/26
|
|
Share - Related Items
Shares Outstanding: 154.20
Most Recent Split Date: (:1)
Beta: 0.75
Market Capitalization: $2,900.54 (millions)
|
|
|
|
|
| |
| • EPS Information |
• Dividend Information |
| Analyst Coverage: No |
Dividend Yield: 2.55% |
| Current Fiscal Quarter EPS Consensus Estimate: $0.40 |
Indicated Annual Dividend: $0.48 |
| Current Fiscal Year EPS Consensus Estimate: $1.72 |
Payout Ratio: 0.32 |
| Number of Estimates in the Fiscal Year Consensus: 5.00 |
Change In Payout Ratio: -0.38 |
| Estmated Long-Term EPS Growth Rate: % |
Last Dividend Paid: 03/16/2026 - $0.12 |
| Next EPS Report Date: 07/22/26 |
|
|
|
| |