| Zacks Company Profile for BigBear.ai Holdings, Inc. (BBAI : NYSE) |
|
|
| |
| • Company Description |
| BigBear.ai is a provider of artificial intelligence, machine learning, cloud-based big data analytics, and cyber engineering solutions. BigBear.ai, formerly known as GigCapital4 Inc., is based in COLUMBIA, Md.
Number of Employees: 579 |
|
|
| |
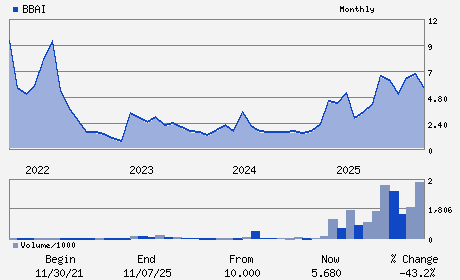
| • Price / Volume Information |
| Yesterday's Closing Price: $3.79 |
Daily Weekly Monthly
 |
| 20 Day Moving Average: 24,872,882 shares |
| Shares Outstanding: 476.06 (millions) |
| Market Capitalization: $1,804.25 (millions) |
| Beta: 3.47 |
| 52 Week High: $9.37 |
| 52 Week Low: $2.36 |
| Short Interest Ratio: |
| |
% Price Change |
% Price Change Relative to S&P 500 |
| 4 Week |
-0.26% |
-5.92% |
| 12 Week |
-33.62% |
-35.02% |
| Year To Date |
-29.82% |
-31.59% |
|
|
|
|
| |
| • Address & Contact Information |
| Street Address |
Phone / Fax |
Email Address |
Web URL |
7950 Jones Branch Drive 1st Floor North Tower
-
McLean,VA 22102
USA |
ph: 410-312-0885
fax: - |
investors@bigbear.ai |
https://bigbear.ai |
|
|
| |
| • General Corporate Information |
Officers
Kevin McAleenan - Chief Executive Officer and Director
Peter Cannito - Chairman
Sean Ricker - Chief Financial Officer
Sean Battle - Director
Pamela Braden - Director
|
|
Peer Information
BigBear.ai Holdings, Inc. (UIS)
BigBear.ai Holdings, Inc. (CTSH)
BigBear.ai Holdings, Inc. (ASGN)
BigBear.ai Holdings, Inc. (GTTNQ)
BigBear.ai Holdings, Inc. (DXC)
BigBear.ai Holdings, Inc. (DOX)
|
|
Industry / Sector / Ticker Info
Analyst Coverage: No
Industry Group: IT Services
Sector: Computer and Technology
CUSIP: 08975B109
SIC: 7372
|
|
Fiscal Year
Fiscal Year End: December
Last Reported Quarter: 12/01/25
Next Expected EPS Date: 05/07/26
|
|
Share - Related Items
Shares Outstanding: 476.06
Most Recent Split Date: (:1)
Beta: 3.47
Market Capitalization: $1,804.25 (millions)
|
|
|
|
|
| |
| • EPS Information |
• Dividend Information |
| Analyst Coverage: No |
Dividend Yield: 0.00% |
| Current Fiscal Quarter EPS Consensus Estimate: $-0.05 |
Indicated Annual Dividend: $0.00 |
| Current Fiscal Year EPS Consensus Estimate: $-0.30 |
Payout Ratio: |
| Number of Estimates in the Fiscal Year Consensus: 3.00 |
Change In Payout Ratio: |
| Estmated Long-Term EPS Growth Rate: % |
Last Dividend Paid: NA - $0.00 |
| Next EPS Report Date: 05/07/26 |
|
|
|
| |