| Zacks Company Profile for BARINGS BDC, INC. (BBDC : NYSE) |
|
|
| |
| • Company Description |
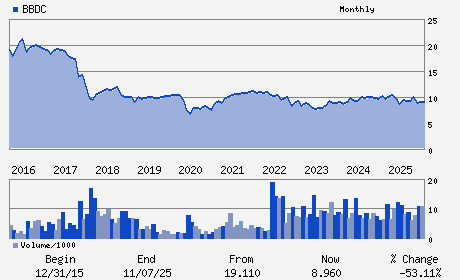
| Barings BDC, Inc. is an externally managed business development company which primarily makes debt investments in middle market companies. The company is primarily managed by Barings, LLC, a premier global asset manager. Barings BDC Inc., formerly known as TRIANGLE CAPITAL CORPORATION, is based in Charlotte, United States.
Number of Employees: |
|
|
| |
| • Price / Volume Information |
| Yesterday's Closing Price: $8.51 |
Daily Weekly Monthly
 |
| 20 Day Moving Average: 740,178 shares |
| Shares Outstanding: 104.71 (millions) |
| Market Capitalization: $891.06 (millions) |
| Beta: 0.61 |
| 52 Week High: $9.92 |
| 52 Week Low: $7.96 |
| Short Interest Ratio: |
| |
% Price Change |
% Price Change Relative to S&P 500 |
| 4 Week |
-2.52% |
-7.28% |
| 12 Week |
-3.08% |
-10.40% |
| Year To Date |
-7.30% |
-14.77% |
|
|
|
|
| |
|
|
| |
| • General Corporate Information |
Officers
Thomas Q. McDonnell - Chief Executive Officer
Eric Lloyd - Executive Chairman
Elizabeth A. Murray - Chief Financial Officer and Chief Operating Offic
Rosa J. Epperson - Chief Accounting Officer
Valerie Lancaster-Beal - Director
|
|
Peer Information
BARINGS BDC, INC. (AVCP)
BARINGS BDC, INC. (FNVG)
BARINGS BDC, INC. (MFIN)
BARINGS BDC, INC. (RAND)
BARINGS BDC, INC. (SFES)
BARINGS BDC, INC. (ACAS)
|
|
Industry / Sector / Ticker Info
Analyst Coverage: No
Industry Group: FIN-SBIC&COMMRL
Sector: Finance
CUSIP: 06759L103
SIC: 6282
|
|
Fiscal Year
Fiscal Year End: December
Last Reported Quarter: 03/01/26
Next Expected EPS Date: 08/06/26
|
|
Share - Related Items
Shares Outstanding: 104.71
Most Recent Split Date: (:1)
Beta: 0.61
Market Capitalization: $891.06 (millions)
|
|
|
|
|
| |
| • EPS Information |
• Dividend Information |
| Analyst Coverage: No |
Dividend Yield: 12.22% |
| Current Fiscal Quarter EPS Consensus Estimate: $0.25 |
Indicated Annual Dividend: $1.04 |
| Current Fiscal Year EPS Consensus Estimate: $0.99 |
Payout Ratio: 0.93 |
| Number of Estimates in the Fiscal Year Consensus: 2.00 |
Change In Payout Ratio: 0.02 |
| Estmated Long-Term EPS Growth Rate: % |
Last Dividend Paid: 03/04/2026 - $0.26 |
| Next EPS Report Date: 08/06/26 |
|
|
|
| |