| Zacks Company Profile for BridgeBio Pharma, Inc. (BBIO : NSDQ) |
|
|
| |
| • Company Description |
| BridgeBio Pharma Inc. is a new type of biopharmaceutical company founded to discover, create, test, and deliver transformative medicines to treat patients who suffer from genetic diseases. BridgeBio Pharma Inc. is based in PALO ALTO, Calif.
Number of Employees: 839 |
|
|
| |
| • Price / Volume Information |
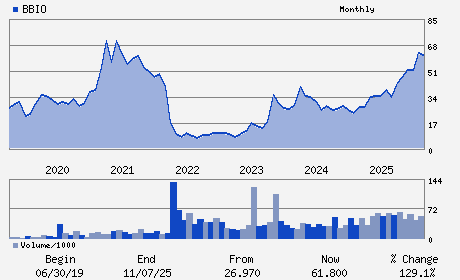
| Yesterday's Closing Price: $69.12 |
Daily Weekly Monthly
 |
| 20 Day Moving Average: 3,355,783 shares |
| Shares Outstanding: 195.86 (millions) |
| Market Capitalization: $13,537.91 (millions) |
| Beta: 1.02 |
| 52 Week High: $84.94 |
| 52 Week Low: $31.77 |
| Short Interest Ratio: |
| |
% Price Change |
% Price Change Relative to S&P 500 |
| 4 Week |
-3.56% |
-8.27% |
| 12 Week |
2.23% |
-5.49% |
| Year To Date |
-9.64% |
-15.53% |
|
|
|
|
| |
| • Address & Contact Information |
| Street Address |
Phone / Fax |
Email Address |
Web URL |
3160 PORTER DR. SUITE 250
-
PALO ALTO,CA 94304
USA |
ph: 650-391-9740
fax: - |
None |
http://www.bridgebio.com |
|
|
| |
| • General Corporate Information |
Officers
Neil Kumar - Chief Executive Officer; Director
Thomas Trimarchi - President; Chief Financial Officer
Maricel M. Apuli - Chief Accounting Officer
Eric Aguiar - Director
Jennifer E. Cook - Director
|
|
Peer Information
BridgeBio Pharma, Inc. (BGMR)
BridgeBio Pharma, Inc. (MGX)
BridgeBio Pharma, Inc. (IPAH)
BridgeBio Pharma, Inc. (BRL)
BridgeBio Pharma, Inc. (BHC)
BridgeBio Pharma, Inc. (AKRXQ)
|
|
Industry / Sector / Ticker Info
Analyst Coverage: No
Industry Group: MED-GENERIC DRG
Sector: Medical
CUSIP: 10806X102
SIC: 2834
|
|
Fiscal Year
Fiscal Year End: December
Last Reported Quarter: 03/01/26
Next Expected EPS Date: 08/04/26
|
|
Share - Related Items
Shares Outstanding: 195.86
Most Recent Split Date: (:1)
Beta: 1.02
Market Capitalization: $13,537.91 (millions)
|
|
|
|
|
| |
| • EPS Information |
• Dividend Information |
| Analyst Coverage: No |
Dividend Yield: 0.00% |
| Current Fiscal Quarter EPS Consensus Estimate: $-0.62 |
Indicated Annual Dividend: $0.00 |
| Current Fiscal Year EPS Consensus Estimate: $-2.27 |
Payout Ratio: |
| Number of Estimates in the Fiscal Year Consensus: 13.00 |
Change In Payout Ratio: |
| Estmated Long-Term EPS Growth Rate: 52.83% |
Last Dividend Paid: NA - $0.00 |
| Next EPS Report Date: 08/04/26 |
|
|
|
| |