| Zacks Company Profile for Braze, Inc. (BRZE : NSDQ) |
|
|
| |
| • Company Description |
| Braze Inc. provide comprehensive customer engagement platform which powers interactions between consumers and brands. The company can ingest and process customer data in real time, orchestrate and optimize contextually relevant, cross-channel marketing campaigns and continuously evolve their customer engagement strategies. It operates principally in Berlin, Chicago, London, San Francisco, Singapore and Tokyo. Braze Inc. is headquartered in New York.
Number of Employees: 1,988 |
|
|
| |
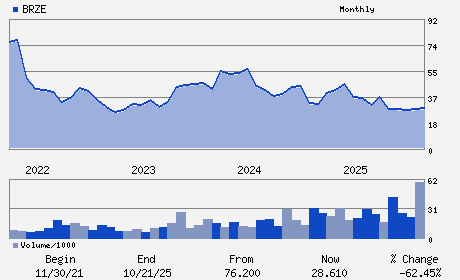
| • Price / Volume Information |
| Yesterday's Closing Price: $22.87 |
Daily Weekly Monthly
 |
| 20 Day Moving Average: 4,208,691 shares |
| Shares Outstanding: 113.45 (millions) |
| Market Capitalization: $2,594.57 (millions) |
| Beta: 0.89 |
| 52 Week High: $37.67 |
| 52 Week Low: $15.26 |
| Short Interest Ratio: |
| |
% Price Change |
% Price Change Relative to S&P 500 |
| 4 Week |
19.05% |
11.70% |
| 12 Week |
-11.46% |
-13.07% |
| Year To Date |
-33.30% |
-35.16% |
|
|
|
|
| |
| • Address & Contact Information |
| Street Address |
Phone / Fax |
Email Address |
Web URL |
63 MADISON BUILDING 28 EAST 28TH STREET FLOOR 12
-
NEW YORK,NY 10016
USA |
ph: 609-964-0585
fax: - |
ir@braze.com |
http://www.braze.com |
|
|
| |
| • General Corporate Information |
Officers
William Magnuson - President and Chief Executive Officer
Isabelle Winkles - Chief Financial Officer
Pankaj Malik - Chief Accounting Officer
Neeraj Agrawal - Director
Phillip M. Fernandez - Director
|
|
Peer Information
Braze, Inc. (ADP)
Braze, Inc. (CWLD)
Braze, Inc. (CYBA.)
Braze, Inc. (ZVLO)
Braze, Inc. (AZPN)
Braze, Inc. (ATIS)
|
|
Industry / Sector / Ticker Info
Analyst Coverage: No
Industry Group: INTERNET SOFTWARE
Sector: Computer and Technology
CUSIP: 10576N102
SIC: 7372
|
|
Fiscal Year
Fiscal Year End: January
Last Reported Quarter: 01/01/26
Next Expected EPS Date: 06/04/26
|
|
Share - Related Items
Shares Outstanding: 113.45
Most Recent Split Date: (:1)
Beta: 0.89
Market Capitalization: $2,594.57 (millions)
|
|
|
|
|
| |
| • EPS Information |
• Dividend Information |
| Analyst Coverage: No |
Dividend Yield: 0.00% |
| Current Fiscal Quarter EPS Consensus Estimate: $-0.25 |
Indicated Annual Dividend: $0.00 |
| Current Fiscal Year EPS Consensus Estimate: $-0.87 |
Payout Ratio: |
| Number of Estimates in the Fiscal Year Consensus: 8.00 |
Change In Payout Ratio: |
| Estmated Long-Term EPS Growth Rate: 30.00% |
Last Dividend Paid: NA - $0.00 |
| Next EPS Report Date: 06/04/26 |
|
|
|
| |