| Zacks Company Profile for Bentley Systems, Incorporated (BSY : NSDQ) |
|
|
| |
| • Company Description |
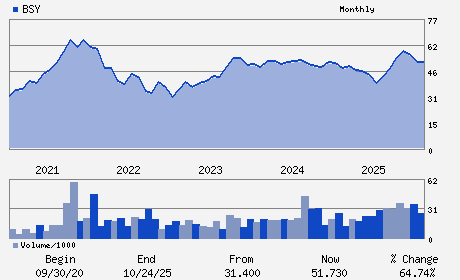
| Bentley Systems Incorporated is a provider of software solutions to engineers, architects, geospatial professionals, constructors and owner-operators for the design, construction and operations of infrastructure. Bentley Systems Incorporated is based in Exton, Pennsylvania.
Number of Employees: 7,900 |
|
|
| |
| • Price / Volume Information |
| Yesterday's Closing Price: $34.05 |
Daily Weekly Monthly
 |
| 20 Day Moving Average: 2,506,301 shares |
| Shares Outstanding: 291.73 (millions) |
| Market Capitalization: $9,933.46 (millions) |
| Beta: 1.16 |
| 52 Week High: $59.25 |
| 52 Week Low: $30.83 |
| Short Interest Ratio: |
| |
% Price Change |
% Price Change Relative to S&P 500 |
| 4 Week |
-8.27% |
-13.47% |
| 12 Week |
-10.63% |
-12.51% |
| Year To Date |
-10.78% |
-13.04% |
|
|
|
|
| |
|
|
| |
| • General Corporate Information |
Officers
Nicholas H. Cumins - Chief Executive Officer
Gregory S. Bentley - Executive Chairman
Werner Andre - Chief Financial Officer
Thomas F. Trimback - Chief Accounting Officer and Controller
Barry J. Bentley - Director
|
|
Peer Information
Bentley Systems, Incorporated (ADP)
Bentley Systems, Incorporated (CWLD)
Bentley Systems, Incorporated (CYBA.)
Bentley Systems, Incorporated (ZVLO)
Bentley Systems, Incorporated (AZPN)
Bentley Systems, Incorporated (ATIS)
|
|
Industry / Sector / Ticker Info
Analyst Coverage: No
Industry Group: INTERNET SOFTWARE
Sector: Computer and Technology
CUSIP: 08265T208
SIC: 7372
|
|
Fiscal Year
Fiscal Year End: December
Last Reported Quarter: 12/01/25
Next Expected EPS Date: 05/07/26
|
|
Share - Related Items
Shares Outstanding: 291.73
Most Recent Split Date: (:1)
Beta: 1.16
Market Capitalization: $9,933.46 (millions)
|
|
|
|
|
| |
| • EPS Information |
• Dividend Information |
| Analyst Coverage: No |
Dividend Yield: 0.82% |
| Current Fiscal Quarter EPS Consensus Estimate: $0.29 |
Indicated Annual Dividend: $0.28 |
| Current Fiscal Year EPS Consensus Estimate: $1.23 |
Payout Ratio: 0.27 |
| Number of Estimates in the Fiscal Year Consensus: 4.00 |
Change In Payout Ratio: 0.03 |
| Estmated Long-Term EPS Growth Rate: 12.14% |
Last Dividend Paid: 03/10/2026 - $0.07 |
| Next EPS Report Date: 05/07/26 |
|
|
|
| |