| Zacks Company Profile for Park Ha Biological Technology Co., Ltd. (BYAH : NSDQ) |
|
|
| |
| • Company Description |
| Park Ha Biological Technology Co., Ltd. is a company focused on developing private skincare labels, direct skincare product sales and franchise alliance promotions. Park Ha Biological Technology Co., Ltd. is based in Wuxi, China.
Number of Employees: 40 |
|
|
| |
| • Price / Volume Information |
| Yesterday's Closing Price: $1.08 |
Daily Weekly Monthly
 |
| 20 Day Moving Average: 23,465 shares |
| Shares Outstanding: 2.10 (millions) |
| Market Capitalization: $2.26 (millions) |
| Beta: -0.52 |
| 52 Week High: $2,074.50 |
| 52 Week Low: $0.93 |
| Short Interest Ratio: |
| |
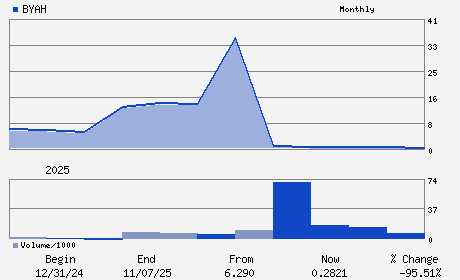
% Price Change |
% Price Change Relative to S&P 500 |
| 4 Week |
0.00% |
-4.88% |
| 12 Week |
-36.47% |
-41.27% |
| Year To Date |
-86.42% |
-87.05% |
|
|
|
|
| |
| • Address & Contact Information |
| Street Address |
Phone / Fax |
Email Address |
Web URL |
901 BUILDING C PHASE 2 WUXI INTERNATIONAL LIFE SCIENCE INNOVATION CAMPUS 196 JINGHUI EAST ROAD
-
WUXI CITY,F4 214000
CHN |
ph: 86-40-0012-7562
fax: - |
ir@parkha.cn |
https://parkha.cn |
|
|
| |
| • General Corporate Information |
Officers
Xiaoqiu Zhang - Chief Executive Officer and Chairperson
Xiaoyan Zhu - Chief Financial Officer
Li Wang - Director
Yanan Shan - Director
Qixiong Sheng - Director
|
|
Peer Information
Park Ha Biological Technology Co., Ltd. (EPC)
Park Ha Biological Technology Co., Ltd. (HPPS)
Park Ha Biological Technology Co., Ltd. (ADRNY)
Park Ha Biological Technology Co., Ltd. (YHGJ)
Park Ha Biological Technology Co., Ltd. (GPSYY)
Park Ha Biological Technology Co., Ltd. (HENKY)
|
|
Industry / Sector / Ticker Info
Analyst Coverage: No
Industry Group: CONS PD- MISC STPL
Sector: Consumer Staples
CUSIP: G6925R110
SIC: 2840
|
|
Fiscal Year
Fiscal Year End: October
Last Reported Quarter: -
Next Expected EPS Date: -
|
|
Share - Related Items
Shares Outstanding: 2.10
Most Recent Split Date: 2.00 (0.02:1)
Beta: -0.52
Market Capitalization: $2.26 (millions)
|
|
|
|
|
| |
| • EPS Information |
• Dividend Information |
| Analyst Coverage: No |
Dividend Yield: 0.00% |
| Current Fiscal Quarter EPS Consensus Estimate: $ |
Indicated Annual Dividend: $0.00 |
| Current Fiscal Year EPS Consensus Estimate: $ |
Payout Ratio: |
| Number of Estimates in the Fiscal Year Consensus: |
Change In Payout Ratio: |
| Estmated Long-Term EPS Growth Rate: % |
Last Dividend Paid: NA - $0.00 |
| Next EPS Report Date: - |
|
|
|
| |